Crow vs Dutch West Indian No Schooling Completed
COMPARE
Crow
Dutch West Indian
No Schooling Completed
No Schooling Completed Comparison
Crow
Dutch West Indians
1.6%
NO SCHOOLING COMPLETED
99.8/ 100
METRIC RATING
54th/ 347
METRIC RANK
2.1%
NO SCHOOLING COMPLETED
59.9/ 100
METRIC RATING
166th/ 347
METRIC RANK
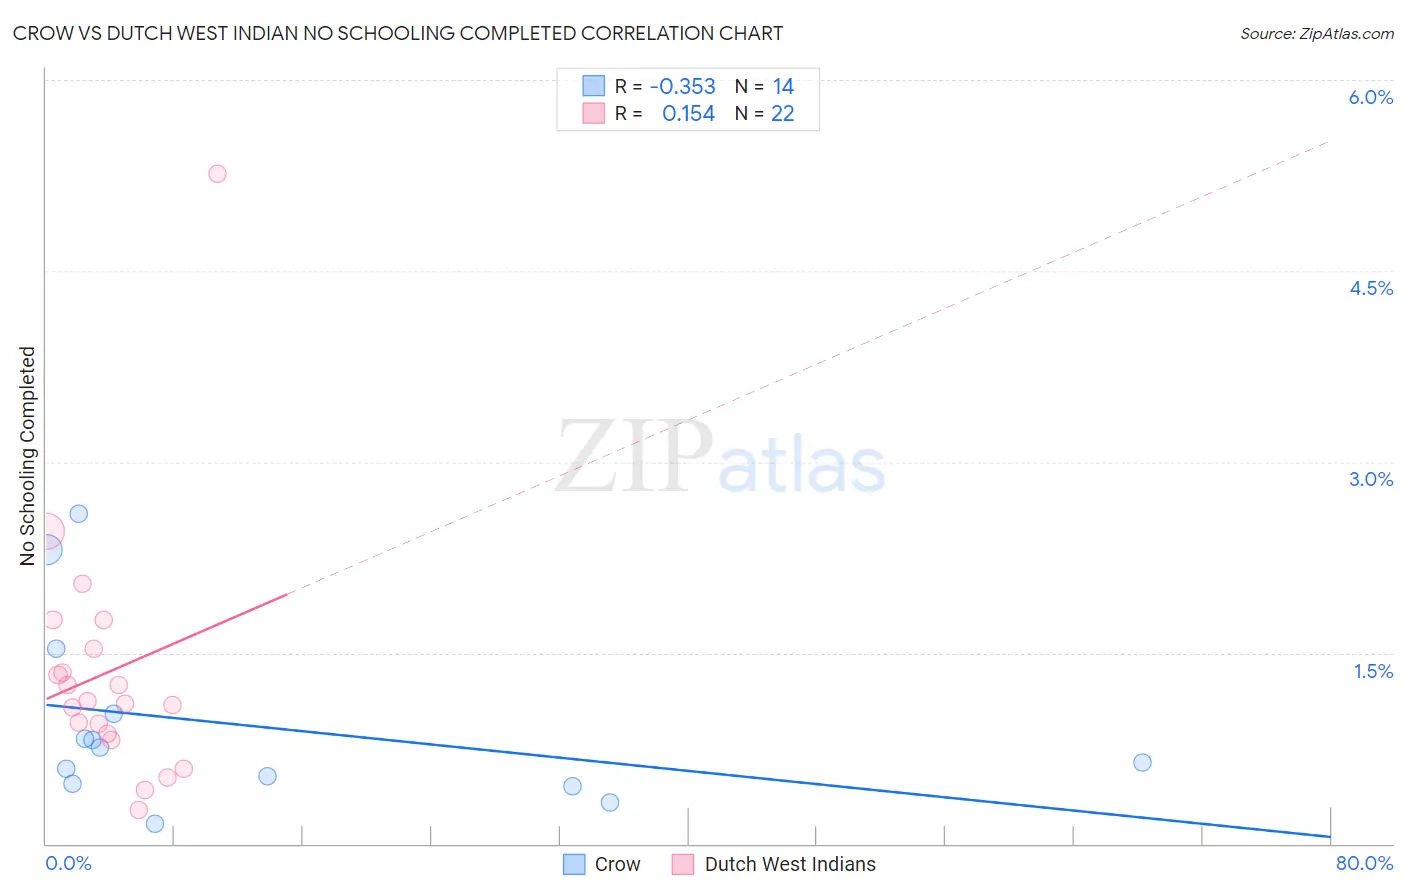
Crow vs Dutch West Indian No Schooling Completed Correlation Chart
The statistical analysis conducted on geographies consisting of 58,922,127 people shows a mild negative correlation between the proportion of Crow and percentage of population with no schooling in the United States with a correlation coefficient (R) of -0.353 and weighted average of 1.6%. Similarly, the statistical analysis conducted on geographies consisting of 85,460,448 people shows a poor positive correlation between the proportion of Dutch West Indians and percentage of population with no schooling in the United States with a correlation coefficient (R) of 0.154 and weighted average of 2.1%, a difference of 25.8%.
No Schooling Completed Correlation Summary
| Measurement | Crow | Dutch West Indian |
| Minimum | 0.16% | 0.27% |
| Maximum | 2.6% | 5.3% |
| Range | 2.4% | 5.0% |
| Mean | 0.93% | 1.4% |
| Median | 0.70% | 1.1% |
| Interquartile 25% (IQ1) | 0.47% | 0.87% |
| Interquartile 75% (IQ3) | 1.0% | 1.5% |
| Interquartile Range (IQR) | 0.55% | 0.66% |
| Standard Deviation (Sample) | 0.73% | 1.0% |
| Standard Deviation (Population) | 0.70% | 1.00% |
Similar Demographics by No Schooling Completed
Demographics Similar to Crow by No Schooling Completed
In terms of no schooling completed, the demographic groups most similar to Crow are Creek (1.6%, a difference of 0.030%), Greek (1.6%, a difference of 0.12%), Immigrants from North America (1.6%, a difference of 0.12%), Immigrants from Canada (1.6%, a difference of 0.16%), and Chippewa (1.6%, a difference of 0.23%).
| Demographics | Rating | Rank | No Schooling Completed |
| Ottawa | 99.9 /100 | #47 | Exceptional 1.6% |
| Immigrants | Scotland | 99.9 /100 | #48 | Exceptional 1.6% |
| Whites/Caucasians | 99.9 /100 | #49 | Exceptional 1.6% |
| Celtics | 99.9 /100 | #50 | Exceptional 1.6% |
| Chippewa | 99.8 /100 | #51 | Exceptional 1.6% |
| Immigrants | Canada | 99.8 /100 | #52 | Exceptional 1.6% |
| Creek | 99.8 /100 | #53 | Exceptional 1.6% |
| Crow | 99.8 /100 | #54 | Exceptional 1.6% |
| Greeks | 99.8 /100 | #55 | Exceptional 1.6% |
| Immigrants | North America | 99.8 /100 | #56 | Exceptional 1.6% |
| Austrians | 99.8 /100 | #57 | Exceptional 1.6% |
| Kiowa | 99.8 /100 | #58 | Exceptional 1.6% |
| Slavs | 99.8 /100 | #59 | Exceptional 1.7% |
| Americans | 99.8 /100 | #60 | Exceptional 1.7% |
| Tsimshian | 99.8 /100 | #61 | Exceptional 1.7% |
Demographics Similar to Dutch West Indians by No Schooling Completed
In terms of no schooling completed, the demographic groups most similar to Dutch West Indians are Brazilian (2.1%, a difference of 0.050%), Egyptian (2.1%, a difference of 0.10%), Comanche (2.1%, a difference of 0.11%), Cheyenne (2.1%, a difference of 0.18%), and Albanian (2.1%, a difference of 0.33%).
| Demographics | Rating | Rank | No Schooling Completed |
| Immigrants | Spain | 66.4 /100 | #159 | Good 2.0% |
| Kenyans | 65.7 /100 | #160 | Good 2.0% |
| Ugandans | 64.6 /100 | #161 | Good 2.0% |
| Immigrants | Brazil | 63.8 /100 | #162 | Good 2.1% |
| Albanians | 62.2 /100 | #163 | Good 2.1% |
| Comanche | 60.7 /100 | #164 | Good 2.1% |
| Brazilians | 60.2 /100 | #165 | Good 2.1% |
| Dutch West Indians | 59.9 /100 | #166 | Average 2.1% |
| Egyptians | 59.2 /100 | #167 | Average 2.1% |
| Cheyenne | 58.6 /100 | #168 | Average 2.1% |
| Apache | 56.7 /100 | #169 | Average 2.1% |
| Argentineans | 56.0 /100 | #170 | Average 2.1% |
| Immigrants | Poland | 55.2 /100 | #171 | Average 2.1% |
| Immigrants | Argentina | 52.7 /100 | #172 | Average 2.1% |
| Immigrants | Belarus | 51.8 /100 | #173 | Average 2.1% |