Crow vs Yakama No Schooling Completed
COMPARE
Crow
Yakama
No Schooling Completed
No Schooling Completed Comparison
Crow
Yakama
1.6%
NO SCHOOLING COMPLETED
99.8/ 100
METRIC RATING
54th/ 347
METRIC RANK
3.6%
NO SCHOOLING COMPLETED
0.0/ 100
METRIC RATING
339th/ 347
METRIC RANK
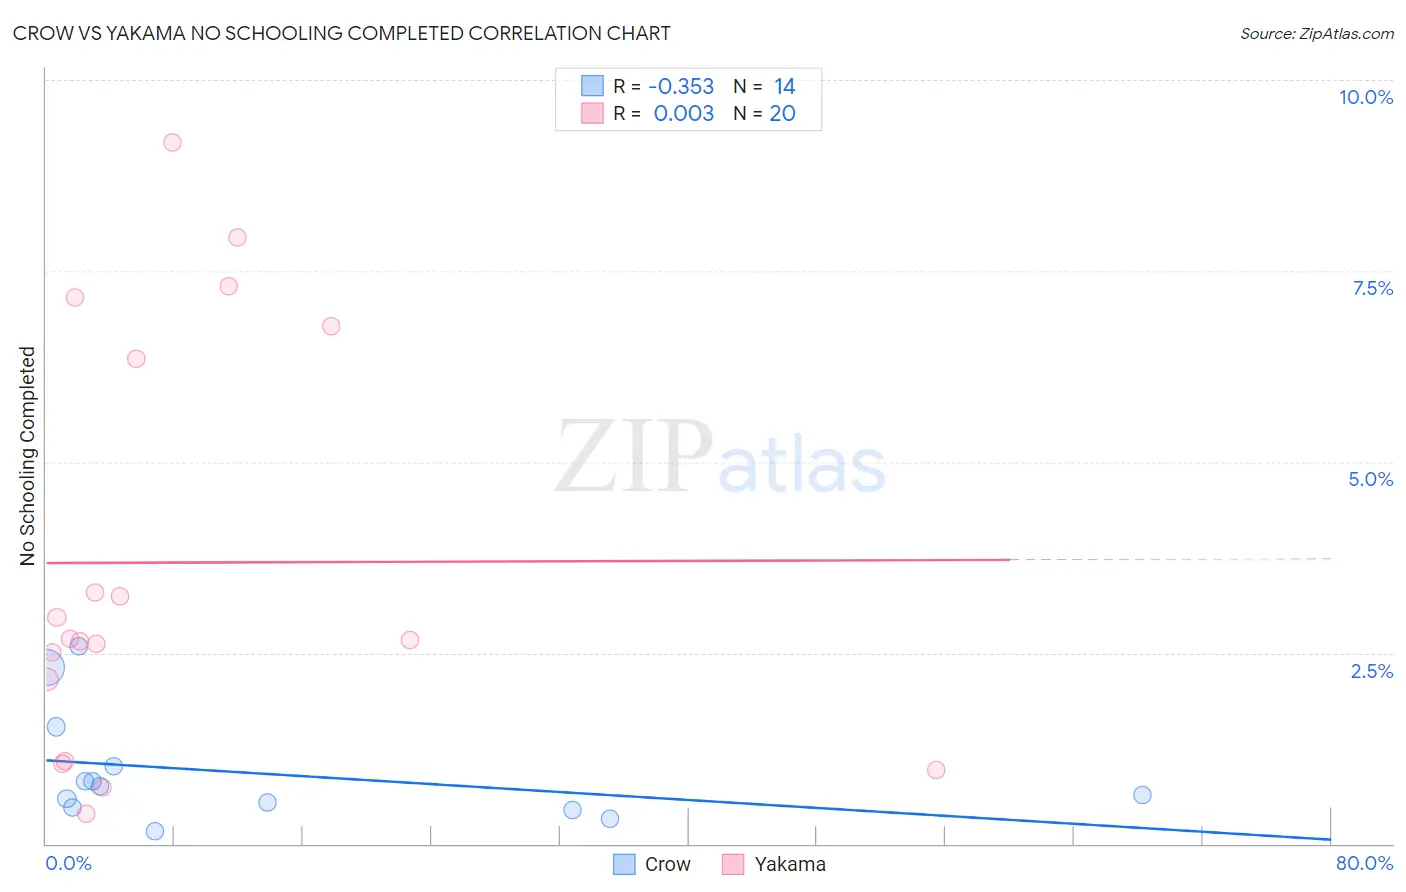
Crow vs Yakama No Schooling Completed Correlation Chart
The statistical analysis conducted on geographies consisting of 58,922,127 people shows a mild negative correlation between the proportion of Crow and percentage of population with no schooling in the United States with a correlation coefficient (R) of -0.353 and weighted average of 1.6%. Similarly, the statistical analysis conducted on geographies consisting of 19,822,084 people shows no correlation between the proportion of Yakama and percentage of population with no schooling in the United States with a correlation coefficient (R) of 0.003 and weighted average of 3.6%, a difference of 116.7%.
No Schooling Completed Correlation Summary
| Measurement | Crow | Yakama |
| Minimum | 0.16% | 0.39% |
| Maximum | 2.6% | 9.2% |
| Range | 2.4% | 8.8% |
| Mean | 0.93% | 3.7% |
| Median | 0.70% | 2.7% |
| Interquartile 25% (IQ1) | 0.47% | 1.6% |
| Interquartile 75% (IQ3) | 1.0% | 6.6% |
| Interquartile Range (IQR) | 0.55% | 4.9% |
| Standard Deviation (Sample) | 0.73% | 2.7% |
| Standard Deviation (Population) | 0.70% | 2.6% |
Similar Demographics by No Schooling Completed
Demographics Similar to Crow by No Schooling Completed
In terms of no schooling completed, the demographic groups most similar to Crow are Creek (1.6%, a difference of 0.030%), Greek (1.6%, a difference of 0.12%), Immigrants from North America (1.6%, a difference of 0.12%), Immigrants from Canada (1.6%, a difference of 0.16%), and Chippewa (1.6%, a difference of 0.23%).
| Demographics | Rating | Rank | No Schooling Completed |
| Ottawa | 99.9 /100 | #47 | Exceptional 1.6% |
| Immigrants | Scotland | 99.9 /100 | #48 | Exceptional 1.6% |
| Whites/Caucasians | 99.9 /100 | #49 | Exceptional 1.6% |
| Celtics | 99.9 /100 | #50 | Exceptional 1.6% |
| Chippewa | 99.8 /100 | #51 | Exceptional 1.6% |
| Immigrants | Canada | 99.8 /100 | #52 | Exceptional 1.6% |
| Creek | 99.8 /100 | #53 | Exceptional 1.6% |
| Crow | 99.8 /100 | #54 | Exceptional 1.6% |
| Greeks | 99.8 /100 | #55 | Exceptional 1.6% |
| Immigrants | North America | 99.8 /100 | #56 | Exceptional 1.6% |
| Austrians | 99.8 /100 | #57 | Exceptional 1.6% |
| Kiowa | 99.8 /100 | #58 | Exceptional 1.6% |
| Slavs | 99.8 /100 | #59 | Exceptional 1.7% |
| Americans | 99.8 /100 | #60 | Exceptional 1.7% |
| Tsimshian | 99.8 /100 | #61 | Exceptional 1.7% |
Demographics Similar to Yakama by No Schooling Completed
In terms of no schooling completed, the demographic groups most similar to Yakama are Bangladeshi (3.5%, a difference of 0.31%), Immigrants from Cabo Verde (3.5%, a difference of 0.55%), Immigrants from Guatemala (3.6%, a difference of 0.68%), Immigrants from Fiji (3.5%, a difference of 1.3%), and Immigrants from Cambodia (3.5%, a difference of 1.6%).
| Demographics | Rating | Rank | No Schooling Completed |
| Central Americans | 0.0 /100 | #332 | Tragic 3.4% |
| Immigrants | Dominican Republic | 0.0 /100 | #333 | Tragic 3.4% |
| Guatemalans | 0.0 /100 | #334 | Tragic 3.5% |
| Immigrants | Cambodia | 0.0 /100 | #335 | Tragic 3.5% |
| Immigrants | Fiji | 0.0 /100 | #336 | Tragic 3.5% |
| Immigrants | Cabo Verde | 0.0 /100 | #337 | Tragic 3.5% |
| Bangladeshis | 0.0 /100 | #338 | Tragic 3.5% |
| Yakama | 0.0 /100 | #339 | Tragic 3.6% |
| Immigrants | Guatemala | 0.0 /100 | #340 | Tragic 3.6% |
| Immigrants | Central America | 0.0 /100 | #341 | Tragic 3.6% |
| Immigrants | Mexico | 0.0 /100 | #342 | Tragic 3.6% |
| Salvadorans | 0.0 /100 | #343 | Tragic 3.7% |
| Nepalese | 0.0 /100 | #344 | Tragic 3.8% |
| Immigrants | El Salvador | 0.0 /100 | #345 | Tragic 3.9% |
| Immigrants | Yemen | 0.0 /100 | #346 | Tragic 4.1% |