Arab vs Jamaican No Schooling Completed
COMPARE
Arab
Jamaican
No Schooling Completed
No Schooling Completed Comparison
Arabs
Jamaicans
2.1%
NO SCHOOLING COMPLETED
46.4/ 100
METRIC RATING
175th/ 347
METRIC RANK
2.4%
NO SCHOOLING COMPLETED
1.2/ 100
METRIC RATING
249th/ 347
METRIC RANK
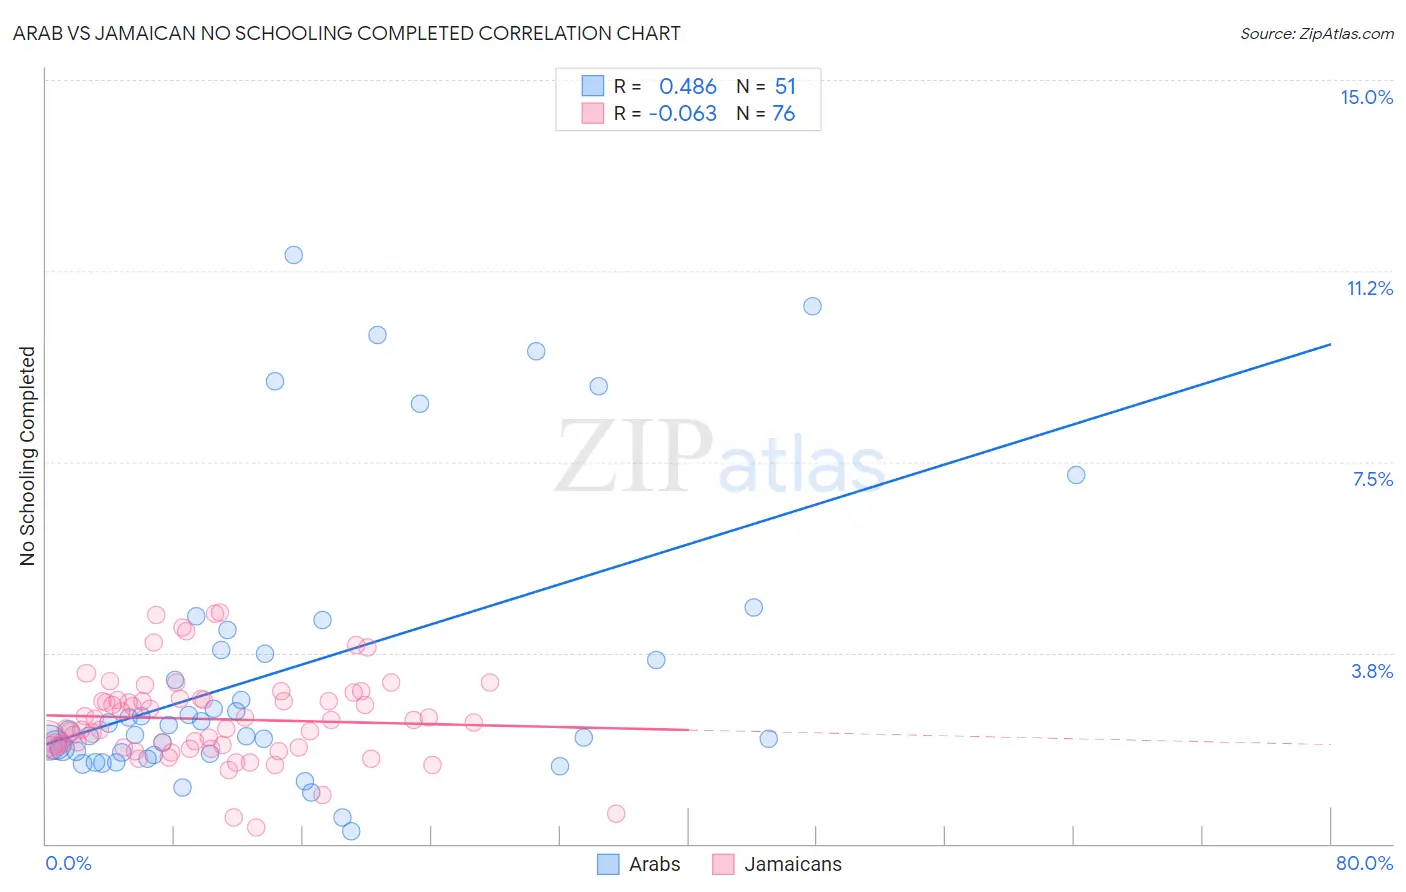
Arab vs Jamaican No Schooling Completed Correlation Chart
The statistical analysis conducted on geographies consisting of 479,384,082 people shows a moderate positive correlation between the proportion of Arabs and percentage of population with no schooling in the United States with a correlation coefficient (R) of 0.486 and weighted average of 2.1%. Similarly, the statistical analysis conducted on geographies consisting of 365,151,455 people shows a slight negative correlation between the proportion of Jamaicans and percentage of population with no schooling in the United States with a correlation coefficient (R) of -0.063 and weighted average of 2.4%, a difference of 14.4%.
No Schooling Completed Correlation Summary
| Measurement | Arab | Jamaican |
| Minimum | 0.23% | 0.32% |
| Maximum | 11.6% | 4.5% |
| Range | 11.3% | 4.2% |
| Mean | 3.4% | 2.4% |
| Median | 2.2% | 2.4% |
| Interquartile 25% (IQ1) | 1.8% | 1.9% |
| Interquartile 75% (IQ3) | 3.8% | 2.8% |
| Interquartile Range (IQR) | 2.0% | 0.94% |
| Standard Deviation (Sample) | 2.8% | 0.87% |
| Standard Deviation (Population) | 2.8% | 0.86% |
Similar Demographics by No Schooling Completed
Demographics Similar to Arabs by No Schooling Completed
In terms of no schooling completed, the demographic groups most similar to Arabs are Panamanian (2.1%, a difference of 0.17%), Arapaho (2.1%, a difference of 0.19%), Pakistani (2.1%, a difference of 0.23%), Immigrants from Kazakhstan (2.1%, a difference of 0.29%), and Portuguese (2.1%, a difference of 0.35%).
| Demographics | Rating | Rank | No Schooling Completed |
| Cheyenne | 58.6 /100 | #168 | Average 2.1% |
| Apache | 56.7 /100 | #169 | Average 2.1% |
| Argentineans | 56.0 /100 | #170 | Average 2.1% |
| Immigrants | Poland | 55.2 /100 | #171 | Average 2.1% |
| Immigrants | Argentina | 52.7 /100 | #172 | Average 2.1% |
| Immigrants | Belarus | 51.8 /100 | #173 | Average 2.1% |
| Immigrants | Micronesia | 50.0 /100 | #174 | Average 2.1% |
| Arabs | 46.4 /100 | #175 | Average 2.1% |
| Panamanians | 45.2 /100 | #176 | Average 2.1% |
| Arapaho | 45.0 /100 | #177 | Average 2.1% |
| Pakistanis | 44.7 /100 | #178 | Average 2.1% |
| Immigrants | Kazakhstan | 44.3 /100 | #179 | Average 2.1% |
| Portuguese | 43.9 /100 | #180 | Average 2.1% |
| Immigrants | Taiwan | 42.6 /100 | #181 | Average 2.1% |
| French American Indians | 42.2 /100 | #182 | Average 2.1% |
Demographics Similar to Jamaicans by No Schooling Completed
In terms of no schooling completed, the demographic groups most similar to Jamaicans are Immigrants from Middle Africa (2.4%, a difference of 0.050%), Immigrants from Africa (2.4%, a difference of 0.070%), Asian (2.4%, a difference of 0.19%), Immigrants from Iraq (2.4%, a difference of 0.45%), and Immigrants from Colombia (2.4%, a difference of 0.51%).
| Demographics | Rating | Rank | No Schooling Completed |
| Immigrants | Indonesia | 1.5 /100 | #242 | Tragic 2.4% |
| South Americans | 1.5 /100 | #243 | Tragic 2.4% |
| Peruvians | 1.4 /100 | #244 | Tragic 2.4% |
| Bolivians | 1.4 /100 | #245 | Tragic 2.4% |
| Immigrants | Congo | 1.4 /100 | #246 | Tragic 2.4% |
| Immigrants | Iraq | 1.3 /100 | #247 | Tragic 2.4% |
| Asians | 1.2 /100 | #248 | Tragic 2.4% |
| Jamaicans | 1.2 /100 | #249 | Tragic 2.4% |
| Immigrants | Middle Africa | 1.1 /100 | #250 | Tragic 2.4% |
| Immigrants | Africa | 1.1 /100 | #251 | Tragic 2.4% |
| Immigrants | Colombia | 1.0 /100 | #252 | Tragic 2.4% |
| Immigrants | Asia | 0.9 /100 | #253 | Tragic 2.4% |
| Immigrants | Eastern Africa | 0.9 /100 | #254 | Tragic 2.4% |
| Ethiopians | 0.8 /100 | #255 | Tragic 2.4% |
| Yaqui | 0.8 /100 | #256 | Tragic 2.4% |