Immigrants from Middle Africa vs Jamaican No Schooling Completed
COMPARE
Immigrants from Middle Africa
Jamaican
No Schooling Completed
No Schooling Completed Comparison
Immigrants from Middle Africa
Jamaicans
2.4%
NO SCHOOLING COMPLETED
1.1/ 100
METRIC RATING
250th/ 347
METRIC RANK
2.4%
NO SCHOOLING COMPLETED
1.2/ 100
METRIC RATING
249th/ 347
METRIC RANK
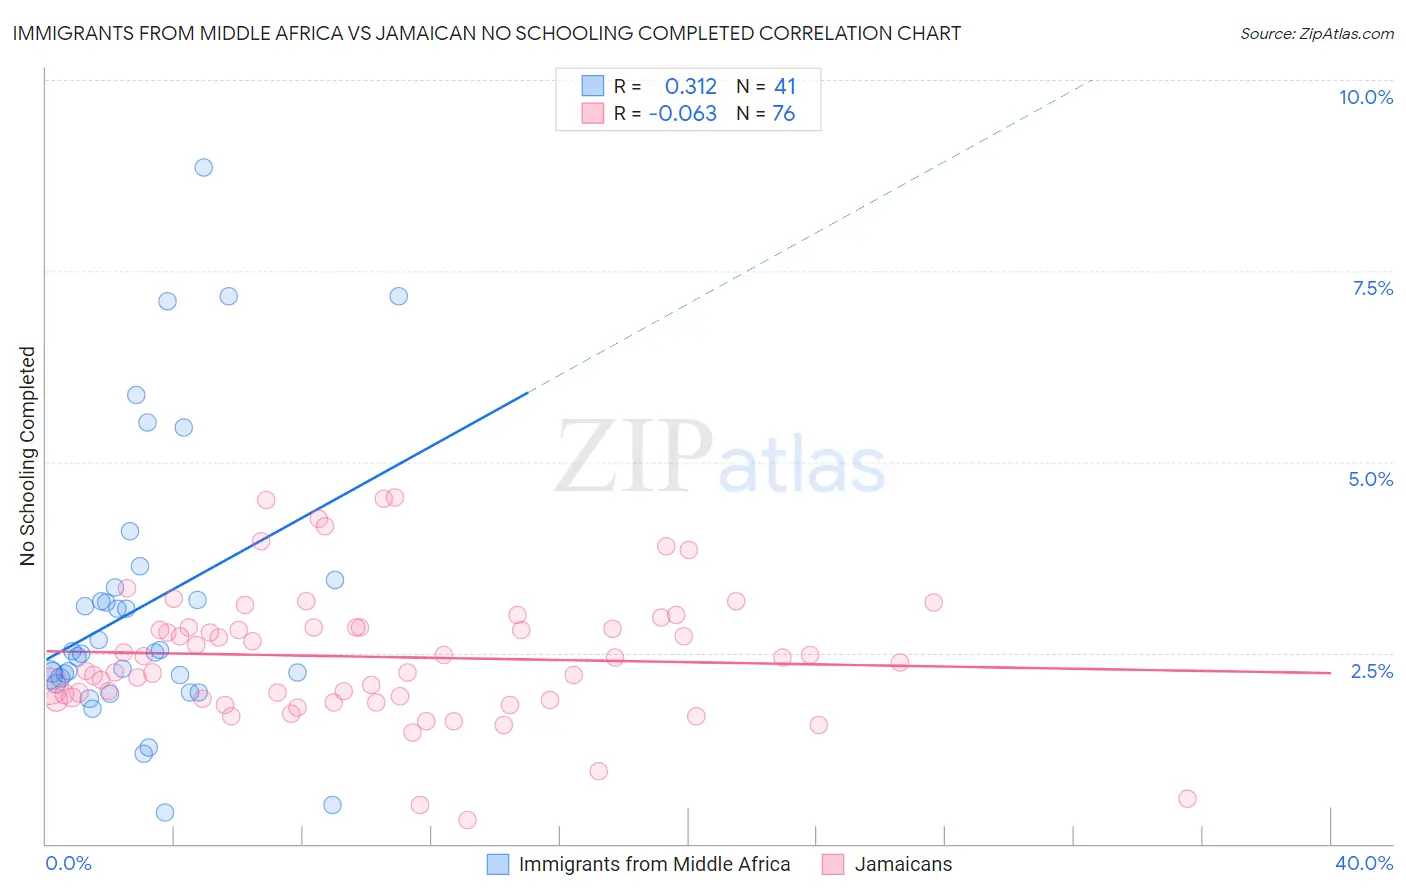
Immigrants from Middle Africa vs Jamaican No Schooling Completed Correlation Chart
The statistical analysis conducted on geographies consisting of 202,107,318 people shows a mild positive correlation between the proportion of Immigrants from Middle Africa and percentage of population with no schooling in the United States with a correlation coefficient (R) of 0.312 and weighted average of 2.4%. Similarly, the statistical analysis conducted on geographies consisting of 365,151,455 people shows a slight negative correlation between the proportion of Jamaicans and percentage of population with no schooling in the United States with a correlation coefficient (R) of -0.063 and weighted average of 2.4%, a difference of 0.050%.
No Schooling Completed Correlation Summary
| Measurement | Immigrants from Middle Africa | Jamaican |
| Minimum | 0.41% | 0.32% |
| Maximum | 8.8% | 4.5% |
| Range | 8.4% | 4.2% |
| Mean | 3.1% | 2.4% |
| Median | 2.5% | 2.4% |
| Interquartile 25% (IQ1) | 2.1% | 1.9% |
| Interquartile 75% (IQ3) | 3.4% | 2.8% |
| Interquartile Range (IQR) | 1.3% | 0.94% |
| Standard Deviation (Sample) | 1.9% | 0.87% |
| Standard Deviation (Population) | 1.8% | 0.86% |
Demographics Similar to Immigrants from Middle Africa and Jamaicans by No Schooling Completed
In terms of no schooling completed, the demographic groups most similar to Immigrants from Middle Africa are Immigrants from Africa (2.4%, a difference of 0.020%), Asian (2.4%, a difference of 0.24%), Immigrants from Colombia (2.4%, a difference of 0.46%), Immigrants from Iraq (2.4%, a difference of 0.50%), and Immigrants from Asia (2.4%, a difference of 0.59%). Similarly, the demographic groups most similar to Jamaicans are Immigrants from Africa (2.4%, a difference of 0.070%), Asian (2.4%, a difference of 0.19%), Immigrants from Iraq (2.4%, a difference of 0.45%), Immigrants from Colombia (2.4%, a difference of 0.51%), and Immigrants from Congo (2.4%, a difference of 0.56%).
| Demographics | Rating | Rank | No Schooling Completed |
| Liberians | 1.8 /100 | #239 | Tragic 2.4% |
| Immigrants | Senegal | 1.7 /100 | #240 | Tragic 2.4% |
| Koreans | 1.7 /100 | #241 | Tragic 2.4% |
| Immigrants | Indonesia | 1.5 /100 | #242 | Tragic 2.4% |
| South Americans | 1.5 /100 | #243 | Tragic 2.4% |
| Peruvians | 1.4 /100 | #244 | Tragic 2.4% |
| Bolivians | 1.4 /100 | #245 | Tragic 2.4% |
| Immigrants | Congo | 1.4 /100 | #246 | Tragic 2.4% |
| Immigrants | Iraq | 1.3 /100 | #247 | Tragic 2.4% |
| Asians | 1.2 /100 | #248 | Tragic 2.4% |
| Jamaicans | 1.2 /100 | #249 | Tragic 2.4% |
| Immigrants | Middle Africa | 1.1 /100 | #250 | Tragic 2.4% |
| Immigrants | Africa | 1.1 /100 | #251 | Tragic 2.4% |
| Immigrants | Colombia | 1.0 /100 | #252 | Tragic 2.4% |
| Immigrants | Asia | 0.9 /100 | #253 | Tragic 2.4% |
| Immigrants | Eastern Africa | 0.9 /100 | #254 | Tragic 2.4% |
| Ethiopians | 0.8 /100 | #255 | Tragic 2.4% |
| Yaqui | 0.8 /100 | #256 | Tragic 2.4% |
| Immigrants | South America | 0.6 /100 | #257 | Tragic 2.5% |
| Assyrians/Chaldeans/Syriacs | 0.6 /100 | #258 | Tragic 2.5% |
| Immigrants | Jamaica | 0.6 /100 | #259 | Tragic 2.5% |