Turkish vs Dutch West Indian No Schooling Completed
COMPARE
Turkish
Dutch West Indian
No Schooling Completed
No Schooling Completed Comparison
Turks
Dutch West Indians
1.8%
NO SCHOOLING COMPLETED
98.7/ 100
METRIC RATING
93rd/ 347
METRIC RANK
2.1%
NO SCHOOLING COMPLETED
59.9/ 100
METRIC RATING
166th/ 347
METRIC RANK
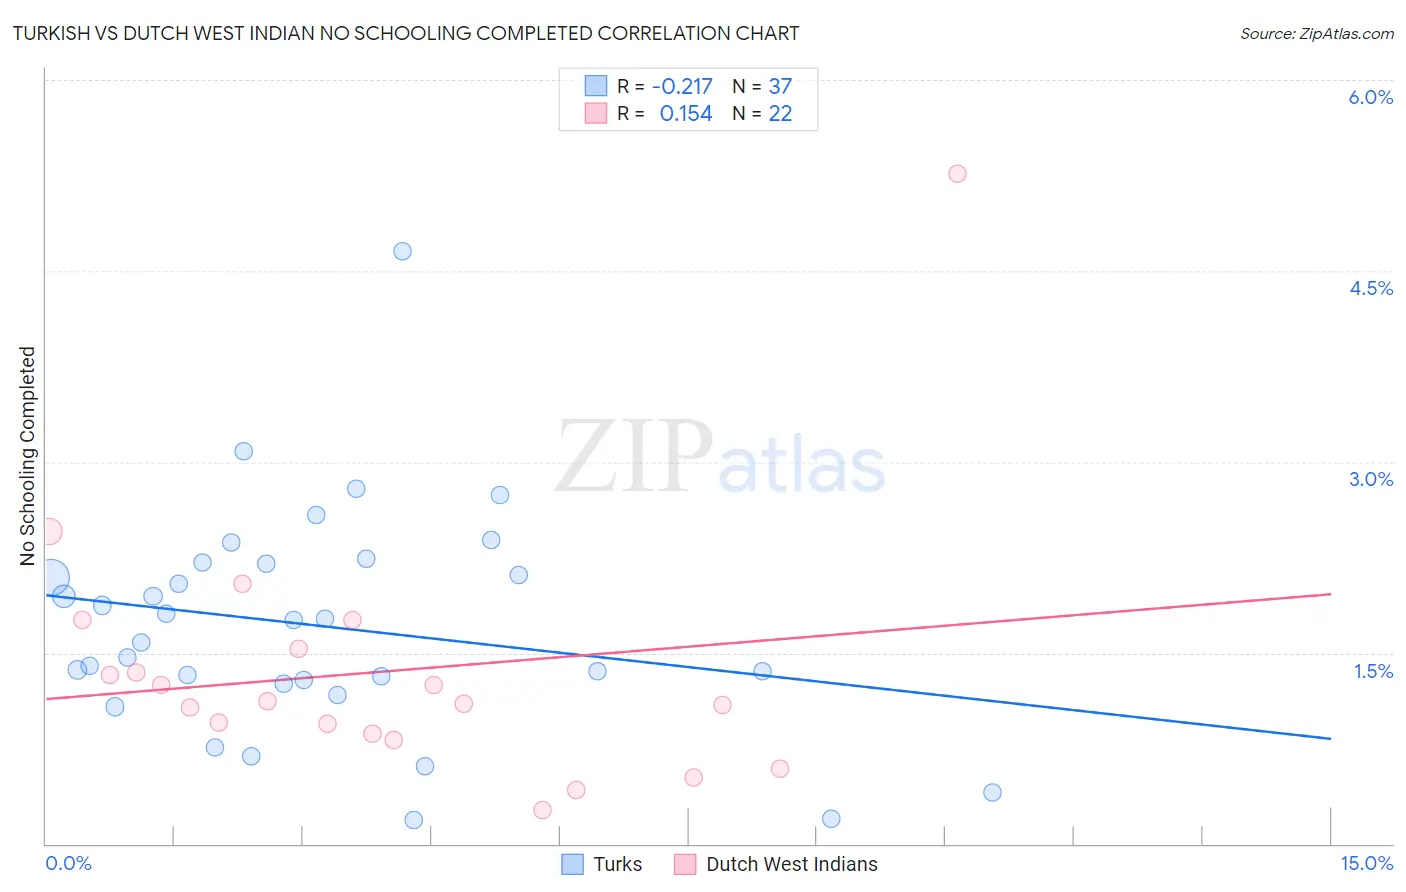
Turkish vs Dutch West Indian No Schooling Completed Correlation Chart
The statistical analysis conducted on geographies consisting of 270,038,657 people shows a weak negative correlation between the proportion of Turks and percentage of population with no schooling in the United States with a correlation coefficient (R) of -0.217 and weighted average of 1.8%. Similarly, the statistical analysis conducted on geographies consisting of 85,460,448 people shows a poor positive correlation between the proportion of Dutch West Indians and percentage of population with no schooling in the United States with a correlation coefficient (R) of 0.154 and weighted average of 2.1%, a difference of 15.4%.
No Schooling Completed Correlation Summary
| Measurement | Turkish | Dutch West Indian |
| Minimum | 0.19% | 0.27% |
| Maximum | 4.7% | 5.3% |
| Range | 4.5% | 5.0% |
| Mean | 1.7% | 1.4% |
| Median | 1.8% | 1.1% |
| Interquartile 25% (IQ1) | 1.3% | 0.87% |
| Interquartile 75% (IQ3) | 2.2% | 1.5% |
| Interquartile Range (IQR) | 0.94% | 0.66% |
| Standard Deviation (Sample) | 0.87% | 1.0% |
| Standard Deviation (Population) | 0.86% | 1.00% |
Similar Demographics by No Schooling Completed
Demographics Similar to Turks by No Schooling Completed
In terms of no schooling completed, the demographic groups most similar to Turks are Romanian (1.8%, a difference of 0.37%), Nonimmigrants (1.8%, a difference of 0.50%), Puget Sound Salish (1.8%, a difference of 0.51%), Bhutanese (1.8%, a difference of 0.74%), and Immigrants from Germany (1.8%, a difference of 0.89%).
| Demographics | Rating | Rank | No Schooling Completed |
| Ukrainians | 99.2 /100 | #86 | Exceptional 1.8% |
| Osage | 99.2 /100 | #87 | Exceptional 1.8% |
| Immigrants | Western Europe | 99.2 /100 | #88 | Exceptional 1.8% |
| South Africans | 99.1 /100 | #89 | Exceptional 1.8% |
| Sioux | 99.0 /100 | #90 | Exceptional 1.8% |
| Immigrants | Germany | 99.0 /100 | #91 | Exceptional 1.8% |
| Romanians | 98.8 /100 | #92 | Exceptional 1.8% |
| Turks | 98.7 /100 | #93 | Exceptional 1.8% |
| Immigrants | Nonimmigrants | 98.5 /100 | #94 | Exceptional 1.8% |
| Puget Sound Salish | 98.5 /100 | #95 | Exceptional 1.8% |
| Bhutanese | 98.4 /100 | #96 | Exceptional 1.8% |
| Immigrants | Ireland | 98.4 /100 | #97 | Exceptional 1.8% |
| Iranians | 98.2 /100 | #98 | Exceptional 1.8% |
| Choctaw | 98.1 /100 | #99 | Exceptional 1.8% |
| Immigrants | Singapore | 98.0 /100 | #100 | Exceptional 1.8% |
Demographics Similar to Dutch West Indians by No Schooling Completed
In terms of no schooling completed, the demographic groups most similar to Dutch West Indians are Brazilian (2.1%, a difference of 0.050%), Egyptian (2.1%, a difference of 0.10%), Comanche (2.1%, a difference of 0.11%), Cheyenne (2.1%, a difference of 0.18%), and Albanian (2.1%, a difference of 0.33%).
| Demographics | Rating | Rank | No Schooling Completed |
| Immigrants | Spain | 66.4 /100 | #159 | Good 2.0% |
| Kenyans | 65.7 /100 | #160 | Good 2.0% |
| Ugandans | 64.6 /100 | #161 | Good 2.0% |
| Immigrants | Brazil | 63.8 /100 | #162 | Good 2.1% |
| Albanians | 62.2 /100 | #163 | Good 2.1% |
| Comanche | 60.7 /100 | #164 | Good 2.1% |
| Brazilians | 60.2 /100 | #165 | Good 2.1% |
| Dutch West Indians | 59.9 /100 | #166 | Average 2.1% |
| Egyptians | 59.2 /100 | #167 | Average 2.1% |
| Cheyenne | 58.6 /100 | #168 | Average 2.1% |
| Apache | 56.7 /100 | #169 | Average 2.1% |
| Argentineans | 56.0 /100 | #170 | Average 2.1% |
| Immigrants | Poland | 55.2 /100 | #171 | Average 2.1% |
| Immigrants | Argentina | 52.7 /100 | #172 | Average 2.1% |
| Immigrants | Belarus | 51.8 /100 | #173 | Average 2.1% |