Laotian vs Dutch West Indian No Schooling Completed
COMPARE
Laotian
Dutch West Indian
No Schooling Completed
No Schooling Completed Comparison
Laotians
Dutch West Indians
2.2%
NO SCHOOLING COMPLETED
13.3/ 100
METRIC RATING
203rd/ 347
METRIC RANK
2.1%
NO SCHOOLING COMPLETED
59.9/ 100
METRIC RATING
166th/ 347
METRIC RANK
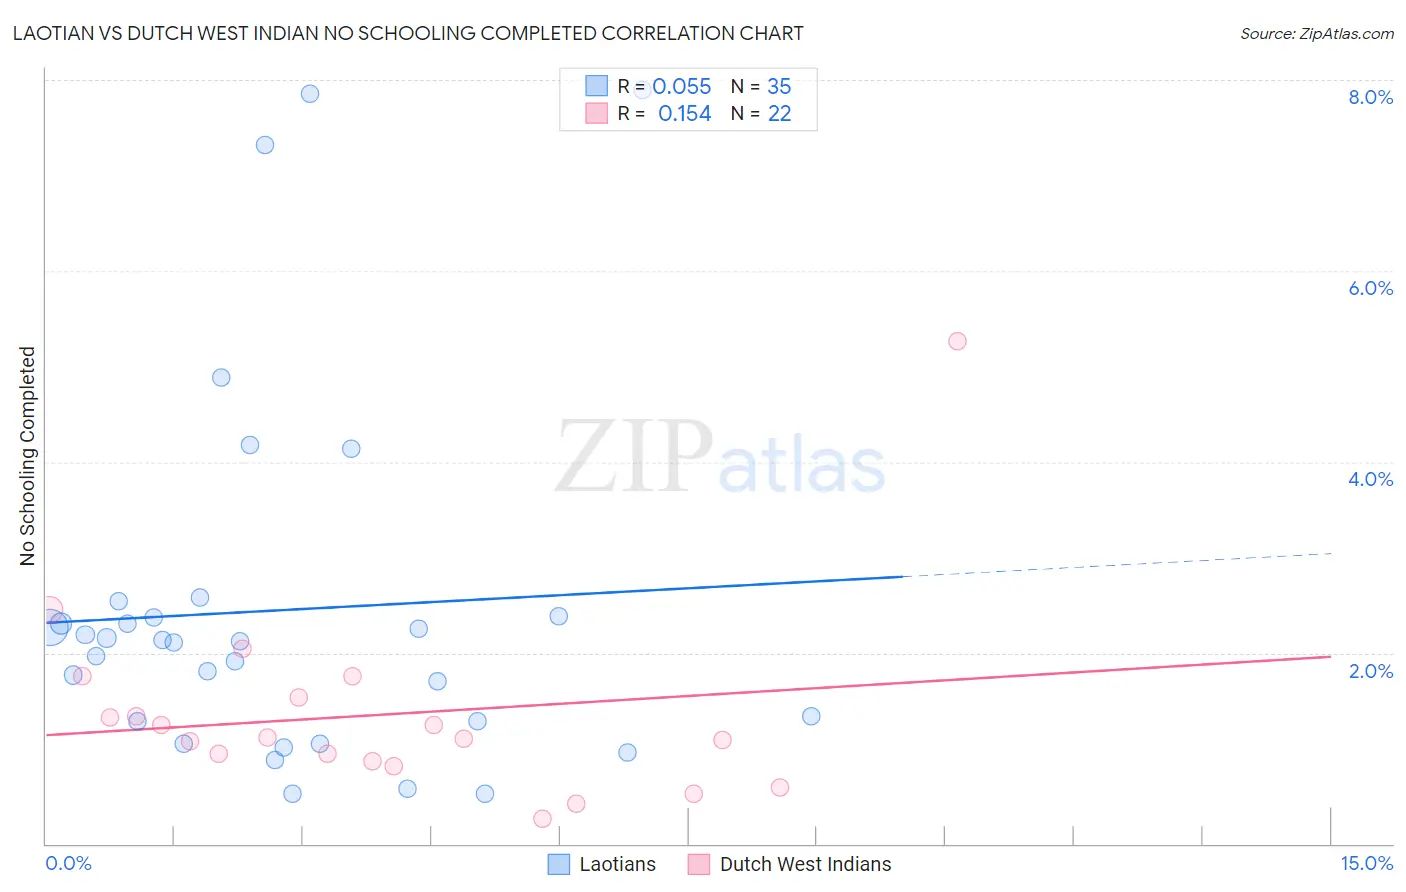
Laotian vs Dutch West Indian No Schooling Completed Correlation Chart
The statistical analysis conducted on geographies consisting of 223,538,268 people shows a slight positive correlation between the proportion of Laotians and percentage of population with no schooling in the United States with a correlation coefficient (R) of 0.055 and weighted average of 2.2%. Similarly, the statistical analysis conducted on geographies consisting of 85,460,448 people shows a poor positive correlation between the proportion of Dutch West Indians and percentage of population with no schooling in the United States with a correlation coefficient (R) of 0.154 and weighted average of 2.1%, a difference of 7.7%.
No Schooling Completed Correlation Summary
| Measurement | Laotian | Dutch West Indian |
| Minimum | 0.52% | 0.27% |
| Maximum | 7.9% | 5.3% |
| Range | 7.4% | 5.0% |
| Mean | 2.4% | 1.4% |
| Median | 2.1% | 1.1% |
| Interquartile 25% (IQ1) | 1.3% | 0.87% |
| Interquartile 75% (IQ3) | 2.4% | 1.5% |
| Interquartile Range (IQR) | 1.1% | 0.66% |
| Standard Deviation (Sample) | 1.9% | 1.0% |
| Standard Deviation (Population) | 1.9% | 1.00% |
Similar Demographics by No Schooling Completed
Demographics Similar to Laotians by No Schooling Completed
In terms of no schooling completed, the demographic groups most similar to Laotians are Moroccan (2.2%, a difference of 0.11%), Hopi (2.2%, a difference of 0.11%), Immigrants from Bahamas (2.2%, a difference of 0.51%), Bahamian (2.2%, a difference of 0.51%), and South American Indian (2.2%, a difference of 0.70%).
| Demographics | Rating | Rank | No Schooling Completed |
| Immigrants | Ukraine | 26.1 /100 | #196 | Fair 2.2% |
| Immigrants | Southern Europe | 23.8 /100 | #197 | Fair 2.2% |
| Immigrants | Chile | 22.7 /100 | #198 | Fair 2.2% |
| Africans | 21.8 /100 | #199 | Fair 2.2% |
| Immigrants | Northern Africa | 19.5 /100 | #200 | Poor 2.2% |
| Costa Ricans | 17.1 /100 | #201 | Poor 2.2% |
| Moroccans | 13.7 /100 | #202 | Poor 2.2% |
| Laotians | 13.3 /100 | #203 | Poor 2.2% |
| Hopi | 12.9 /100 | #204 | Poor 2.2% |
| Immigrants | Bahamas | 11.6 /100 | #205 | Poor 2.2% |
| Bahamians | 11.6 /100 | #206 | Poor 2.2% |
| South American Indians | 11.0 /100 | #207 | Poor 2.2% |
| Uruguayans | 11.0 /100 | #208 | Poor 2.2% |
| Immigrants | Oceania | 10.2 /100 | #209 | Poor 2.2% |
| Natives/Alaskans | 10.0 /100 | #210 | Tragic 2.2% |
Demographics Similar to Dutch West Indians by No Schooling Completed
In terms of no schooling completed, the demographic groups most similar to Dutch West Indians are Brazilian (2.1%, a difference of 0.050%), Egyptian (2.1%, a difference of 0.10%), Comanche (2.1%, a difference of 0.11%), Cheyenne (2.1%, a difference of 0.18%), and Albanian (2.1%, a difference of 0.33%).
| Demographics | Rating | Rank | No Schooling Completed |
| Immigrants | Spain | 66.4 /100 | #159 | Good 2.0% |
| Kenyans | 65.7 /100 | #160 | Good 2.0% |
| Ugandans | 64.6 /100 | #161 | Good 2.0% |
| Immigrants | Brazil | 63.8 /100 | #162 | Good 2.1% |
| Albanians | 62.2 /100 | #163 | Good 2.1% |
| Comanche | 60.7 /100 | #164 | Good 2.1% |
| Brazilians | 60.2 /100 | #165 | Good 2.1% |
| Dutch West Indians | 59.9 /100 | #166 | Average 2.1% |
| Egyptians | 59.2 /100 | #167 | Average 2.1% |
| Cheyenne | 58.6 /100 | #168 | Average 2.1% |
| Apache | 56.7 /100 | #169 | Average 2.1% |
| Argentineans | 56.0 /100 | #170 | Average 2.1% |
| Immigrants | Poland | 55.2 /100 | #171 | Average 2.1% |
| Immigrants | Argentina | 52.7 /100 | #172 | Average 2.1% |
| Immigrants | Belarus | 51.8 /100 | #173 | Average 2.1% |