Creek vs Palestinian Kindergarten
COMPARE
Creek
Palestinian
Kindergarten
Kindergarten Comparison
Creek
Palestinians
98.4%
KINDERGARTEN
99.7/ 100
METRIC RATING
60th/ 347
METRIC RANK
98.1%
KINDERGARTEN
83.6/ 100
METRIC RATING
140th/ 347
METRIC RANK
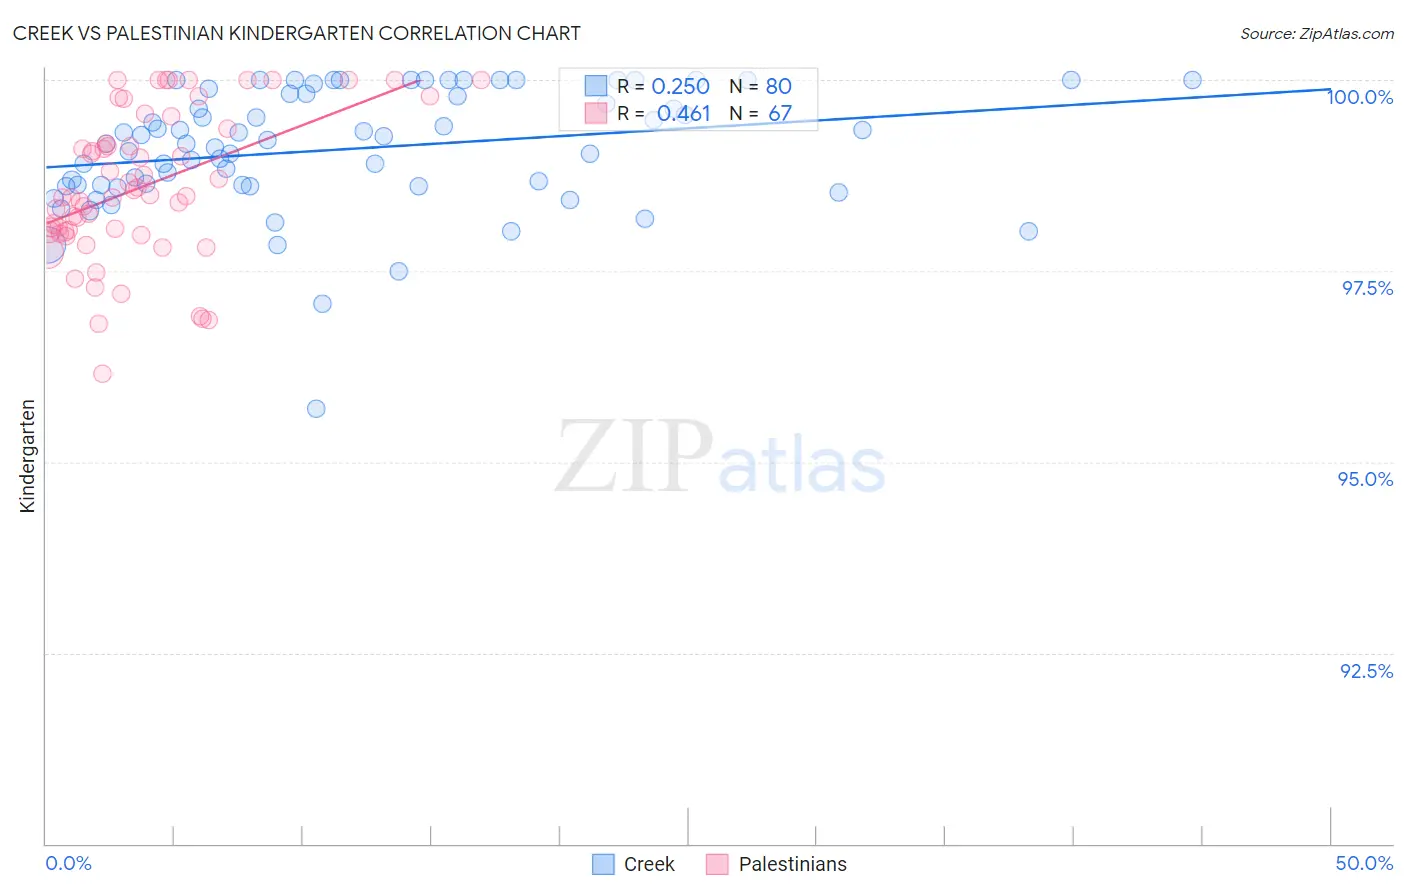
Creek vs Palestinian Kindergarten Correlation Chart
The statistical analysis conducted on geographies consisting of 178,480,663 people shows a weak positive correlation between the proportion of Creek and percentage of population with at least kindergarten education in the United States with a correlation coefficient (R) of 0.250 and weighted average of 98.4%. Similarly, the statistical analysis conducted on geographies consisting of 216,457,008 people shows a moderate positive correlation between the proportion of Palestinians and percentage of population with at least kindergarten education in the United States with a correlation coefficient (R) of 0.461 and weighted average of 98.1%, a difference of 0.33%.
Kindergarten Correlation Summary
| Measurement | Creek | Palestinian |
| Minimum | 95.7% | 96.1% |
| Maximum | 100.0% | 100.0% |
| Range | 4.3% | 3.9% |
| Mean | 99.1% | 98.6% |
| Median | 99.2% | 98.5% |
| Interquartile 25% (IQ1) | 98.6% | 98.0% |
| Interquartile 75% (IQ3) | 99.8% | 99.4% |
| Interquartile Range (IQR) | 1.2% | 1.4% |
| Standard Deviation (Sample) | 0.80% | 0.96% |
| Standard Deviation (Population) | 0.80% | 0.95% |
Similar Demographics by Kindergarten
Demographics Similar to Creek by Kindergarten
In terms of kindergarten, the demographic groups most similar to Creek are Bulgarian (98.4%, a difference of 0.0%), Immigrants from Canada (98.4%, a difference of 0.0%), Slavic (98.4%, a difference of 0.0%), New Zealander (98.4%, a difference of 0.0%), and Immigrants from North America (98.4%, a difference of 0.0%).
| Demographics | Rating | Rank | Kindergarten |
| Celtics | 99.8 /100 | #53 | Exceptional 98.4% |
| Pueblo | 99.8 /100 | #54 | Exceptional 98.4% |
| Immigrants | Scotland | 99.8 /100 | #55 | Exceptional 98.4% |
| Americans | 99.8 /100 | #56 | Exceptional 98.4% |
| Austrians | 99.8 /100 | #57 | Exceptional 98.4% |
| Bulgarians | 99.7 /100 | #58 | Exceptional 98.4% |
| Immigrants | Canada | 99.7 /100 | #59 | Exceptional 98.4% |
| Creek | 99.7 /100 | #60 | Exceptional 98.4% |
| Slavs | 99.7 /100 | #61 | Exceptional 98.4% |
| New Zealanders | 99.7 /100 | #62 | Exceptional 98.4% |
| Immigrants | North America | 99.7 /100 | #63 | Exceptional 98.4% |
| Greeks | 99.7 /100 | #64 | Exceptional 98.4% |
| Maltese | 99.7 /100 | #65 | Exceptional 98.4% |
| Cheyenne | 99.6 /100 | #66 | Exceptional 98.4% |
| Canadians | 99.6 /100 | #67 | Exceptional 98.4% |
Demographics Similar to Palestinians by Kindergarten
In terms of kindergarten, the demographic groups most similar to Palestinians are Marshallese (98.1%, a difference of 0.0%), Immigrants from Turkey (98.1%, a difference of 0.0%), Burmese (98.1%, a difference of 0.010%), Alsatian (98.1%, a difference of 0.020%), and Hmong (98.1%, a difference of 0.020%).
| Demographics | Rating | Rank | Kindergarten |
| Immigrants | Europe | 90.4 /100 | #133 | Exceptional 98.1% |
| Immigrants | Bulgaria | 89.4 /100 | #134 | Excellent 98.1% |
| Immigrants | Kuwait | 89.2 /100 | #135 | Excellent 98.1% |
| Immigrants | Hungary | 89.1 /100 | #136 | Excellent 98.1% |
| Blackfeet | 87.8 /100 | #137 | Excellent 98.1% |
| Immigrants | Romania | 87.7 /100 | #138 | Excellent 98.1% |
| Israelis | 87.7 /100 | #139 | Excellent 98.1% |
| Palestinians | 83.6 /100 | #140 | Excellent 98.1% |
| Marshallese | 83.0 /100 | #141 | Excellent 98.1% |
| Immigrants | Turkey | 82.8 /100 | #142 | Excellent 98.1% |
| Burmese | 81.5 /100 | #143 | Excellent 98.1% |
| Alsatians | 80.4 /100 | #144 | Excellent 98.1% |
| Hmong | 78.8 /100 | #145 | Good 98.1% |
| Filipinos | 78.3 /100 | #146 | Good 98.0% |
| Immigrants | Israel | 77.6 /100 | #147 | Good 98.0% |