Polish vs Palestinian Professional Degree

COMPARE

Polish
Race
Ancestry
AfghanAfricanAlaska NativeAlaskan AthabascanAlbanianAleutAlsatianAmericanApacheArabArapahoArgentineanArmenianAssyrian/Chaldean/SyriacAustralianAustrianBahamianBangladeshiBarbadianBasqueBelgianBelizeanBermudanBhutaneseBlackfeetBolivianBrazilianBritishBritish West IndianBulgarianBurmeseCajunCambodianCanadianCape VerdeanCarpatho RusynCelticCentral AmericanCentral American IndianCherokeeCheyenneChickasawChileanChineseChippewaChoctawColombianColvilleComancheCosta RicanCreeCreekCroatianCrowCubanCypriotCzechCzechoslovakianDanishDelawareDominicanDutchDutch West IndianEastern EuropeanEcuadorianEgyptianEnglishEstonianEthiopianEuropeanFijianFilipinoFinnishFrenchFrench American IndianFrench CanadianGermanGerman RussianGhanaianGreekGuamanian/ChamorroGuatemalanGuyaneseHaitianHmongHonduranHopiHoumaHungarianIcelanderIndian (Asian)IndonesianInupiatIranianIraqiIrishIroquoisIsraeliItalianJamaicanJapaneseJordanianKenyanKiowaKoreanLaotianLatvianLebaneseLiberianLithuanianLumbeeLuxembourgerMacedonianMalaysianMalteseMarshalleseMenomineeMexicanMexican American IndianMongolianMoroccanNative HawaiianNavajoNepaleseNew ZealanderNicaraguanNigerianNorthern EuropeanNorwegianOkinawanOsageOttawaPaiutePakistaniPanamanianParaguayanPennsylvania GermanPeruvianPimaPolishPortuguesePotawatomiPuebloPuerto RicanPuget Sound SalishRomanianRussianSalvadoranSamoanScandinavianScotch-IrishScottishSeminoleSenegaleseSerbianShoshoneSierra LeoneanSiouxSlavicSlovakSloveneSomaliSouth AfricanSouth AmericanSouth American IndianSoviet UnionSpaniardSpanishSpanish AmericanSpanish American IndianSri LankanSubsaharan AfricanSudaneseSwedishSwissSyrianTaiwaneseThaiTlingit-HaidaTohono O'OdhamTonganTrinidadian and TobagonianTsimshianTurkishU.S. Virgin IslanderUgandanUkrainianUruguayanUteVenezuelanVietnameseWelshWest IndianYakamaYaquiYugoslavianYumanYup'ikZimbabwean
Immigration
NonimmigrantsImmigrantsAfghanistanAfricaAlbaniaArgentinaArmeniaAsiaAustraliaAustriaBahamasBangladeshBarbadosBelarusBelgiumBelizeBoliviaBosnia and HerzegovinaBrazilBulgariaBurma/MyanmarCabo VerdeCambodiaCameroonCanadaCaribbeanCentral AmericaChileChinaColombiaCongoCosta RicaCroatiaCubaCzechoslovakiaDenmarkDominicaDominican RepublicEastern AfricaEastern AsiaEastern EuropeEcuadorEgyptEl SalvadorEnglandEritreaEthiopiaEuropeFijiFranceGermanyGhanaGreeceGrenadaGuatemalaGuyanaHaitiHondurasHong KongHungaryIndiaIndonesiaIranIraqIrelandIsraelItalyJamaicaJapanJordanKazakhstanKenyaKoreaKuwaitLaosLatin AmericaLatviaLebanonLiberiaLithuaniaMalaysiaMexicoMicronesiaMiddle AfricaMoldovaMoroccoNepalNetherlandsNicaraguaNigeriaNorth AmericaNorth MacedoniaNorthern AfricaNorthern EuropeNorwayOceaniaPakistanPanamaPeruPhilippinesPolandPortugalRomaniaRussiaSaudi ArabiaScotlandSenegalSerbiaSierra LeoneSingaporeSomaliaSouth AfricaSouth AmericaSouth Central AsiaSouth Eastern AsiaSouthern EuropeSpainSri LankaSt. Vincent and the GrenadinesSudanSwedenSwitzerlandSyriaTaiwanThailandTrinidad and TobagoTurkeyUgandaUkraineUruguayUzbekistanVenezuelaVietnamWest IndiesWestern AfricaWestern AsiaWestern EuropeYemenZaireZimbabweAzores
Palestinian
Race
Ancestry
AfghanAfricanAlaska NativeAlaskan AthabascanAlbanianAleutAlsatianAmericanApacheArabArapahoArgentineanArmenianAssyrian/Chaldean/SyriacAustralianAustrianBahamianBangladeshiBarbadianBasqueBelgianBelizeanBermudanBhutaneseBlackfeetBolivianBrazilianBritishBritish West IndianBulgarianBurmeseCajunCambodianCanadianCape VerdeanCarpatho RusynCelticCentral AmericanCentral American IndianCherokeeCheyenneChickasawChileanChineseChippewaChoctawColombianColvilleComancheCosta RicanCreeCreekCroatianCrowCubanCypriotCzechCzechoslovakianDanishDelawareDominicanDutchDutch West IndianEastern EuropeanEcuadorianEgyptianEnglishEstonianEthiopianEuropeanFijianFilipinoFinnishFrenchFrench American IndianFrench CanadianGermanGerman RussianGhanaianGreekGuamanian/ChamorroGuatemalanGuyaneseHaitianHmongHonduranHopiHoumaHungarianIcelanderIndian (Asian)IndonesianInupiatIranianIraqiIrishIroquoisIsraeliItalianJamaicanJapaneseJordanianKenyanKiowaKoreanLaotianLatvianLebaneseLiberianLithuanianLumbeeLuxembourgerMacedonianMalaysianMalteseMarshalleseMenomineeMexicanMexican American IndianMongolianMoroccanNative HawaiianNavajoNepaleseNew ZealanderNicaraguanNigerianNorthern EuropeanNorwegianOkinawanOsageOttawaPaiutePakistaniPalestinianPanamanianParaguayanPennsylvania GermanPeruvianPimaPortuguesePotawatomiPuebloPuerto RicanPuget Sound SalishRomanianRussianSalvadoranSamoanScandinavianScotch-IrishScottishSeminoleSenegaleseSerbianShoshoneSierra LeoneanSiouxSlavicSlovakSloveneSomaliSouth AfricanSouth AmericanSouth American IndianSoviet UnionSpaniardSpanishSpanish AmericanSpanish American IndianSri LankanSubsaharan AfricanSudaneseSwedishSwissSyrianTaiwaneseThaiTlingit-HaidaTohono O'OdhamTonganTrinidadian and TobagonianTsimshianTurkishU.S. Virgin IslanderUgandanUkrainianUruguayanUteVenezuelanVietnameseWelshWest IndianYakamaYaquiYugoslavianYumanYup'ikZimbabwean
Immigration
NonimmigrantsImmigrantsAfghanistanAfricaAlbaniaArgentinaArmeniaAsiaAustraliaAustriaBahamasBangladeshBarbadosBelarusBelgiumBelizeBoliviaBosnia and HerzegovinaBrazilBulgariaBurma/MyanmarCabo VerdeCambodiaCameroonCanadaCaribbeanCentral AmericaChileChinaColombiaCongoCosta RicaCroatiaCubaCzechoslovakiaDenmarkDominicaDominican RepublicEastern AfricaEastern AsiaEastern EuropeEcuadorEgyptEl SalvadorEnglandEritreaEthiopiaEuropeFijiFranceGermanyGhanaGreeceGrenadaGuatemalaGuyanaHaitiHondurasHong KongHungaryIndiaIndonesiaIranIraqIrelandIsraelItalyJamaicaJapanJordanKazakhstanKenyaKoreaKuwaitLaosLatin AmericaLatviaLebanonLiberiaLithuaniaMalaysiaMexicoMicronesiaMiddle AfricaMoldovaMoroccoNepalNetherlandsNicaraguaNigeriaNorth AmericaNorth MacedoniaNorthern AfricaNorthern EuropeNorwayOceaniaPakistanPanamaPeruPhilippinesPolandPortugalRomaniaRussiaSaudi ArabiaScotlandSenegalSerbiaSierra LeoneSingaporeSomaliaSouth AfricaSouth AmericaSouth Central AsiaSouth Eastern AsiaSouthern EuropeSpainSri LankaSt. Vincent and the GrenadinesSudanSwedenSwitzerlandSyriaTaiwanThailandTrinidad and TobagoTurkeyUgandaUkraineUruguayUzbekistanVenezuelaVietnamWest IndiesWestern AfricaWestern AsiaWestern EuropeYemenZaireZimbabweAzores
Professional Degree
Income
Poverty
Unemployment
Labor Participation
Family Structure
Vehicle Availability
Education Level
Disability

Professional Degree Comparison

Poles

Palestinians

Good
Exceptional
4.6%
PROFESSIONAL DEGREE
72.6/ 100
METRIC RATING
151st/ 347
METRIC RANK
4.8%
PROFESSIONAL DEGREE
91.5/ 100
METRIC RATING
129th/ 347
METRIC RANK

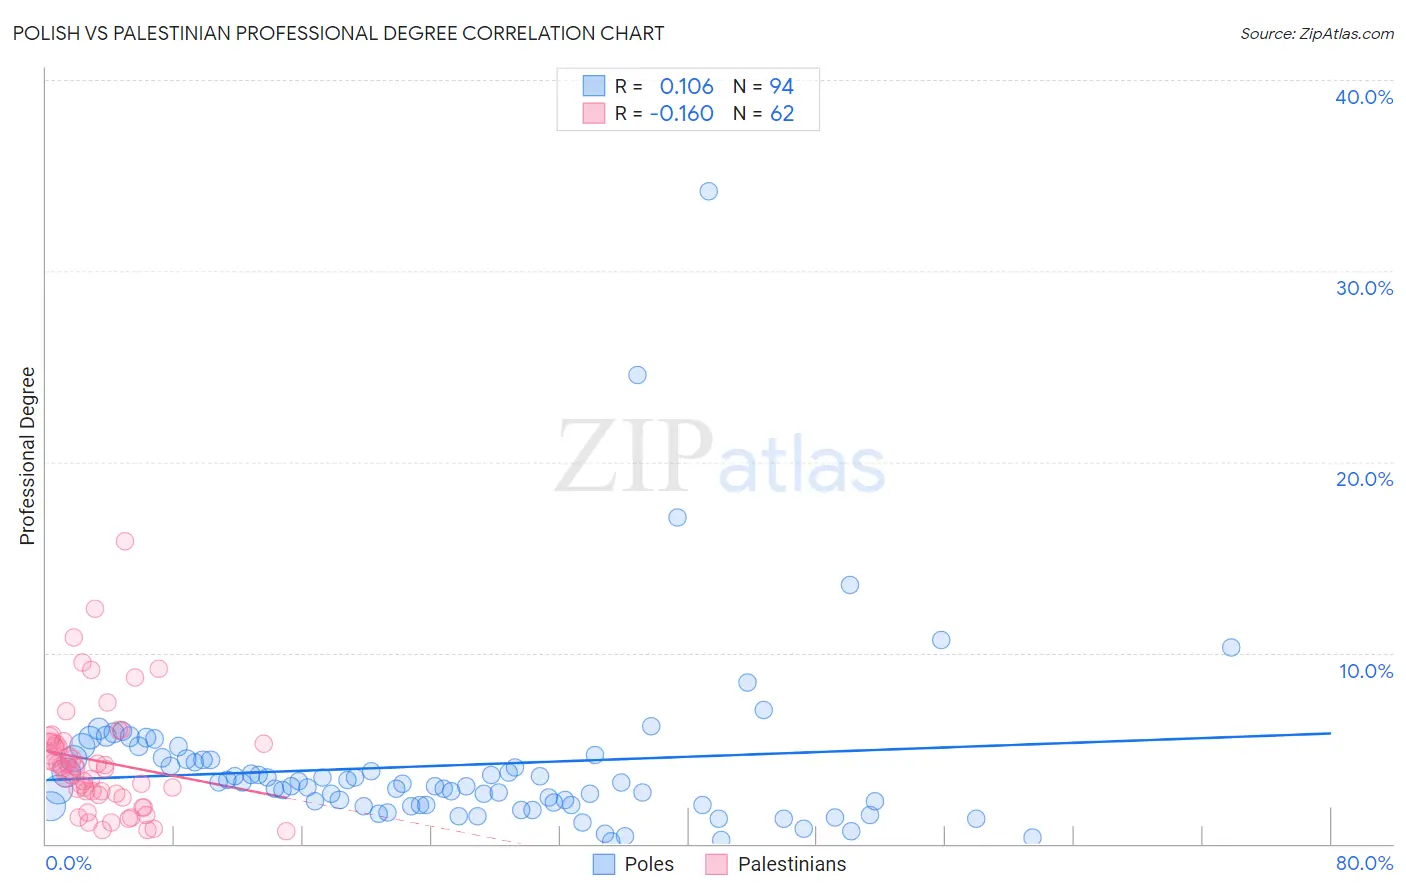
Polish vs Palestinian Professional Degree Correlation Chart

The statistical analysis conducted on geographies consisting of 553,734,682 people shows a poor positive correlation between the proportion of Poles and percentage of population with at least professional degree education in the United States with a correlation coefficient (R) of 0.106 and weighted average of 4.6%. Similarly, the statistical analysis conducted on geographies consisting of 216,348,582 people shows a poor negative correlation between the proportion of Palestinians and percentage of population with at least professional degree education in the United States with a correlation coefficient (R) of -0.160 and weighted average of 4.8%, a difference of 4.9%.
Polish vs Palestinian Professional Degree

Professional Degree Correlation Summary

MeasurementPolishPalestinian
Minimum0.12%0.66%
Maximum34.2%15.9%
Range34.0%15.2%
Mean4.1%4.3%
Median3.1%4.0%
Interquartile 25% (IQ1)2.0%2.6%
Interquartile 75% (IQ3)4.4%5.2%
Interquartile Range (IQR)2.4%2.6%
Standard Deviation (Sample)4.6%2.9%
Standard Deviation (Population)4.6%2.9%

Similar Demographics by Professional Degree

Demographics Similar to Poles by Professional Degree

In terms of professional degree, the demographic groups most similar to Poles are Immigrants from Africa (4.6%, a difference of 0.010%), Immigrants from Uruguay (4.6%, a difference of 0.020%), Immigrants from Oceania (4.6%, a difference of 0.14%), Scottish (4.6%, a difference of 0.14%), and Slavic (4.5%, a difference of 0.31%).
DemographicsRating | RankProfessional Degree
Immigrants | South America
80.5
/100
|
#144
Excellent
4.6%
Uruguayans
80.2
/100
|
#145
Excellent
4.6%
Luxembourgers
78.7
/100
|
#146
Good
4.6%
Colombians
77.7
/100
|
#147
Good
4.6%
Slovenes
76.1
/100
|
#148
Good
4.6%
Senegalese
75.3
/100
|
#149
Good
4.6%
Immigrants | Oceania
73.4
/100
|
#150
Good
4.6%
Poles
72.6
/100
|
#151
Good
4.6%
Immigrants | Africa
72.5
/100
|
#152
Good
4.6%
Immigrants | Uruguay
72.5
/100
|
#153
Good
4.6%
Scottish
71.8
/100
|
#154
Good
4.6%
Slavs
70.8
/100
|
#155
Good
4.5%
Swedes
69.9
/100
|
#156
Good
4.5%
Iraqis
69.8
/100
|
#157
Good
4.5%
Immigrants | Armenia
68.8
/100
|
#158
Good
4.5%

Demographics Similar to Palestinians by Professional Degree

In terms of professional degree, the demographic groups most similar to Palestinians are Icelander (4.8%, a difference of 0.030%), Immigrants from Nepal (4.8%, a difference of 0.050%), Pakistani (4.8%, a difference of 0.27%), Immigrants from Eastern Africa (4.8%, a difference of 0.46%), and Serbian (4.8%, a difference of 0.48%).
DemographicsRating | RankProfessional Degree
Immigrants | Germany
94.1
/100
|
#122
Exceptional
4.9%
Immigrants | Venezuela
93.8
/100
|
#123
Exceptional
4.8%
Immigrants | Eritrea
93.5
/100
|
#124
Exceptional
4.8%
Immigrants | Albania
93.3
/100
|
#125
Exceptional
4.8%
Europeans
93.2
/100
|
#126
Exceptional
4.8%
Serbians
92.6
/100
|
#127
Exceptional
4.8%
Immigrants | Eastern Africa
92.5
/100
|
#128
Exceptional
4.8%
Palestinians
91.5
/100
|
#129
Exceptional
4.8%
Icelanders
91.5
/100
|
#130
Exceptional
4.8%
Immigrants | Nepal
91.4
/100
|
#131
Exceptional
4.8%
Pakistanis
90.9
/100
|
#132
Exceptional
4.8%
Italians
90.2
/100
|
#133
Exceptional
4.8%
South American Indians
89.9
/100
|
#134
Excellent
4.8%
Macedonians
89.8
/100
|
#135
Excellent
4.8%
Immigrants | Jordan
89.0
/100
|
#136
Excellent
4.7%