Iroquois vs Cuban High School Diploma
COMPARE
Iroquois
Cuban
High School Diploma
High School Diploma Comparison
Iroquois
Cubans
89.2%
HIGH SCHOOL DIPLOMA
55.1/ 100
METRIC RATING
169th/ 347
METRIC RANK
85.4%
HIGH SCHOOL DIPLOMA
0.0/ 100
METRIC RATING
303rd/ 347
METRIC RANK
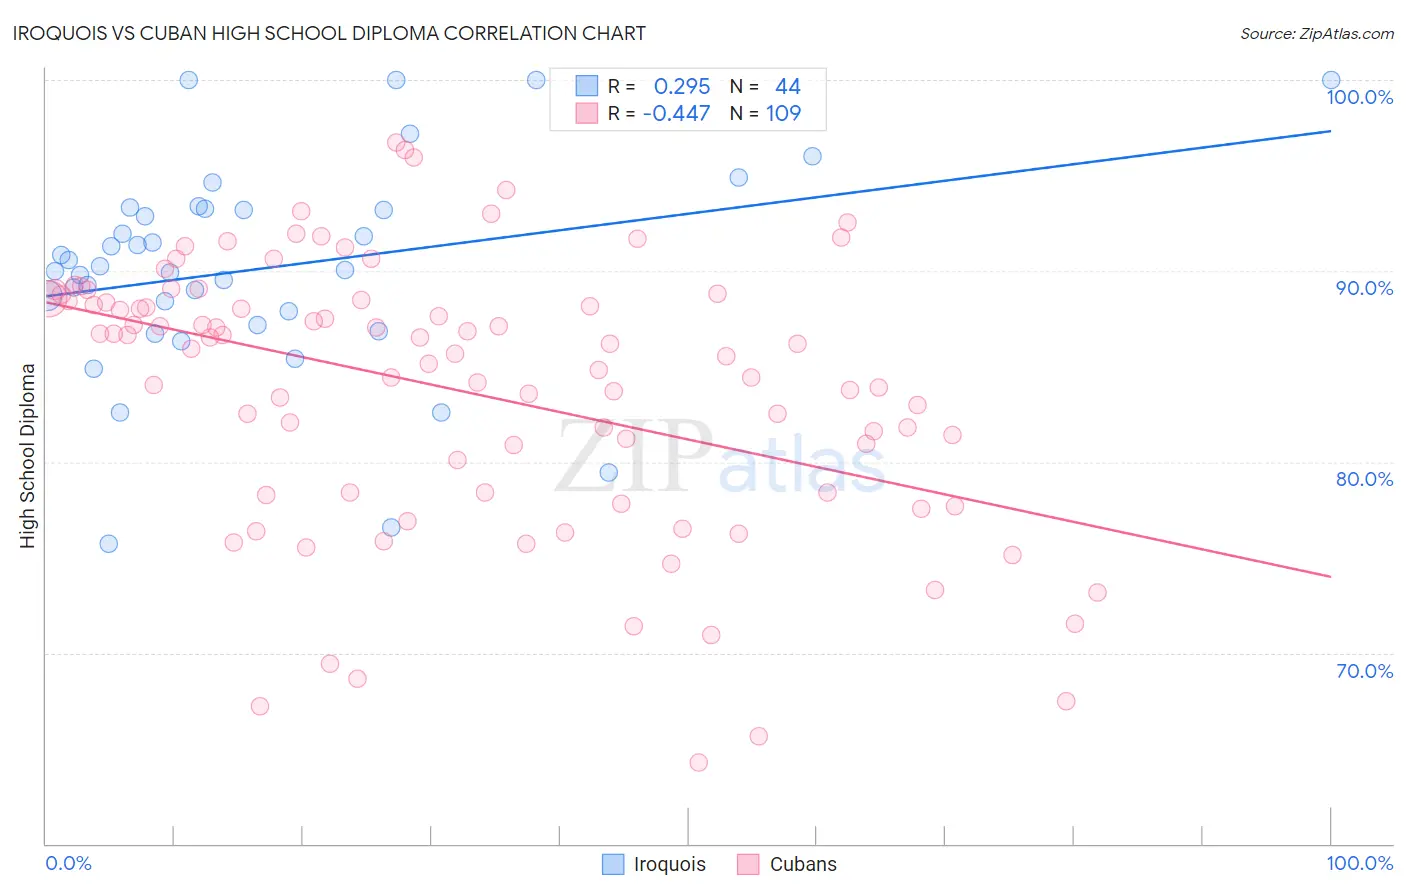
Iroquois vs Cuban High School Diploma Correlation Chart
The statistical analysis conducted on geographies consisting of 207,308,653 people shows a weak positive correlation between the proportion of Iroquois and percentage of population with at least high school diploma education in the United States with a correlation coefficient (R) of 0.295 and weighted average of 89.2%. Similarly, the statistical analysis conducted on geographies consisting of 449,373,028 people shows a moderate negative correlation between the proportion of Cubans and percentage of population with at least high school diploma education in the United States with a correlation coefficient (R) of -0.447 and weighted average of 85.4%, a difference of 4.5%.
High School Diploma Correlation Summary
| Measurement | Iroquois | Cuban |
| Minimum | 75.7% | 64.2% |
| Maximum | 100.0% | 96.7% |
| Range | 24.3% | 32.5% |
| Mean | 90.2% | 83.8% |
| Median | 90.1% | 85.9% |
| Interquartile 25% (IQ1) | 87.5% | 78.4% |
| Interquartile 75% (IQ3) | 93.3% | 88.5% |
| Interquartile Range (IQR) | 5.7% | 10.1% |
| Standard Deviation (Sample) | 5.5% | 7.1% |
| Standard Deviation (Population) | 5.5% | 7.0% |
Similar Demographics by High School Diploma
Demographics Similar to Iroquois by High School Diploma
In terms of high school diploma, the demographic groups most similar to Iroquois are Delaware (89.2%, a difference of 0.010%), Immigrants from Morocco (89.2%, a difference of 0.030%), Spanish (89.2%, a difference of 0.030%), Immigrants from Hong Kong (89.3%, a difference of 0.050%), and Nonimmigrants (89.2%, a difference of 0.050%).
| Demographics | Rating | Rank | High School Diploma |
| Bermudans | 61.1 /100 | #162 | Good 89.3% |
| Cree | 61.1 /100 | #163 | Good 89.3% |
| Immigrants | Nepal | 61.1 /100 | #164 | Good 89.3% |
| Immigrants | Asia | 59.8 /100 | #165 | Average 89.3% |
| Immigrants | Albania | 59.4 /100 | #166 | Average 89.3% |
| Immigrants | Hong Kong | 58.6 /100 | #167 | Average 89.3% |
| Delaware | 55.8 /100 | #168 | Average 89.2% |
| Iroquois | 55.1 /100 | #169 | Average 89.2% |
| Immigrants | Morocco | 53.3 /100 | #170 | Average 89.2% |
| Spanish | 52.9 /100 | #171 | Average 89.2% |
| Immigrants | Nonimmigrants | 51.8 /100 | #172 | Average 89.2% |
| Immigrants | Indonesia | 50.3 /100 | #173 | Average 89.1% |
| Hmong | 50.0 /100 | #174 | Average 89.1% |
| Immigrants | Western Asia | 49.0 /100 | #175 | Average 89.1% |
| Osage | 48.9 /100 | #176 | Average 89.1% |
Demographics Similar to Cubans by High School Diploma
In terms of high school diploma, the demographic groups most similar to Cubans are Immigrants from Haiti (85.4%, a difference of 0.0%), Vietnamese (85.4%, a difference of 0.040%), Immigrants from Bangladesh (85.5%, a difference of 0.060%), Guyanese (85.5%, a difference of 0.080%), and Nepalese (85.3%, a difference of 0.11%).
| Demographics | Rating | Rank | High School Diploma |
| Immigrants | Cambodia | 0.0 /100 | #296 | Tragic 85.6% |
| Immigrants | Grenada | 0.0 /100 | #297 | Tragic 85.6% |
| Natives/Alaskans | 0.0 /100 | #298 | Tragic 85.6% |
| Guyanese | 0.0 /100 | #299 | Tragic 85.5% |
| Immigrants | Bangladesh | 0.0 /100 | #300 | Tragic 85.5% |
| Vietnamese | 0.0 /100 | #301 | Tragic 85.4% |
| Immigrants | Haiti | 0.0 /100 | #302 | Tragic 85.4% |
| Cubans | 0.0 /100 | #303 | Tragic 85.4% |
| Nepalese | 0.0 /100 | #304 | Tragic 85.3% |
| Immigrants | Portugal | 0.0 /100 | #305 | Tragic 85.3% |
| Immigrants | Guyana | 0.0 /100 | #306 | Tragic 85.3% |
| Navajo | 0.0 /100 | #307 | Tragic 85.2% |
| Immigrants | Armenia | 0.0 /100 | #308 | Tragic 85.2% |
| Immigrants | Dominica | 0.0 /100 | #309 | Tragic 85.2% |
| Apache | 0.0 /100 | #310 | Tragic 85.1% |