Cree vs Ugandan 3rd Grade
COMPARE
Cree
Ugandan
3rd Grade
3rd Grade Comparison
Cree
Ugandans
98.1%
3RD GRADE
97.9/ 100
METRIC RATING
100th/ 347
METRIC RANK
97.8%
3RD GRADE
56.1/ 100
METRIC RATING
165th/ 347
METRIC RANK
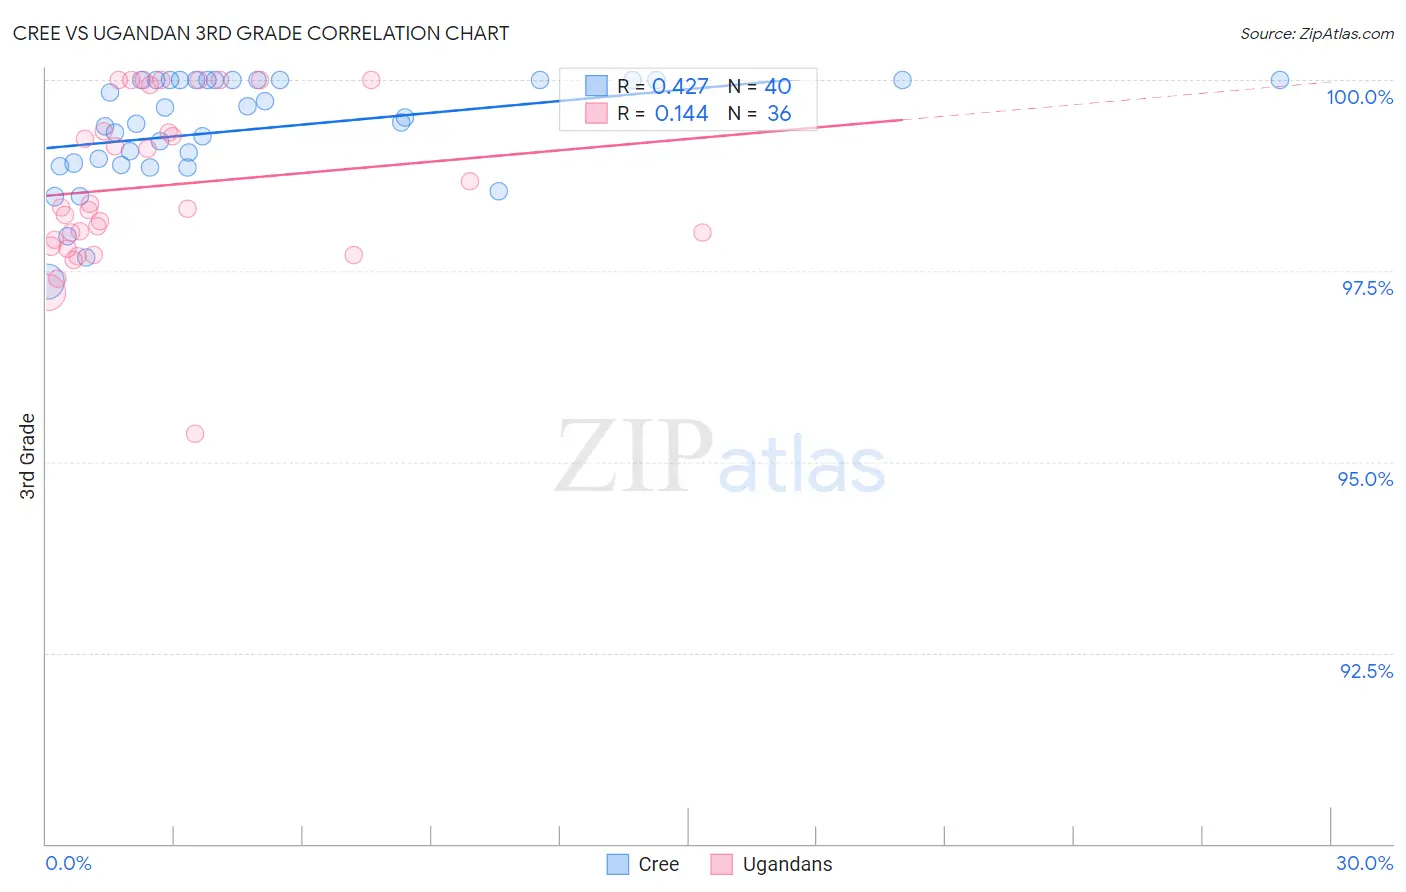
Cree vs Ugandan 3rd Grade Correlation Chart
The statistical analysis conducted on geographies consisting of 76,204,399 people shows a moderate positive correlation between the proportion of Cree and percentage of population with at least 3rd grade education in the United States with a correlation coefficient (R) of 0.427 and weighted average of 98.1%. Similarly, the statistical analysis conducted on geographies consisting of 93,991,892 people shows a poor positive correlation between the proportion of Ugandans and percentage of population with at least 3rd grade education in the United States with a correlation coefficient (R) of 0.144 and weighted average of 97.8%, a difference of 0.31%.
3rd Grade Correlation Summary
| Measurement | Cree | Ugandan |
| Minimum | 97.4% | 95.4% |
| Maximum | 100.0% | 100.0% |
| Range | 2.6% | 4.6% |
| Mean | 99.4% | 98.6% |
| Median | 99.5% | 98.3% |
| Interquartile 25% (IQ1) | 98.9% | 97.9% |
| Interquartile 75% (IQ3) | 100.0% | 99.6% |
| Interquartile Range (IQR) | 1.1% | 1.8% |
| Standard Deviation (Sample) | 0.70% | 1.1% |
| Standard Deviation (Population) | 0.69% | 1.1% |
Similar Demographics by 3rd Grade
Demographics Similar to Cree by 3rd Grade
In terms of 3rd grade, the demographic groups most similar to Cree are Choctaw (98.1%, a difference of 0.0%), Romanian (98.1%, a difference of 0.0%), Puget Sound Salish (98.1%, a difference of 0.0%), Nonimmigrants (98.1%, a difference of 0.0%), and Immigrants from Ireland (98.1%, a difference of 0.010%).
| Demographics | Rating | Rank | 3rd Grade |
| Immigrants | Western Europe | 98.7 /100 | #93 | Exceptional 98.1% |
| Immigrants | Germany | 98.4 /100 | #94 | Exceptional 98.1% |
| Cypriots | 98.4 /100 | #95 | Exceptional 98.1% |
| Immigrants | Ireland | 98.2 /100 | #96 | Exceptional 98.1% |
| South Africans | 98.2 /100 | #97 | Exceptional 98.1% |
| Choctaw | 98.0 /100 | #98 | Exceptional 98.1% |
| Romanians | 98.0 /100 | #99 | Exceptional 98.1% |
| Cree | 97.9 /100 | #100 | Exceptional 98.1% |
| Puget Sound Salish | 97.9 /100 | #101 | Exceptional 98.1% |
| Immigrants | Nonimmigrants | 97.8 /100 | #102 | Exceptional 98.1% |
| Yugoslavians | 97.7 /100 | #103 | Exceptional 98.1% |
| Turks | 97.6 /100 | #104 | Exceptional 98.1% |
| German Russians | 97.2 /100 | #105 | Exceptional 98.1% |
| Bhutanese | 97.2 /100 | #106 | Exceptional 98.1% |
| Immigrants | Czechoslovakia | 97.0 /100 | #107 | Exceptional 98.0% |
Demographics Similar to Ugandans by 3rd Grade
In terms of 3rd grade, the demographic groups most similar to Ugandans are Marshallese (97.8%, a difference of 0.0%), Immigrants from Bosnia and Herzegovina (97.8%, a difference of 0.0%), Dutch West Indian (97.8%, a difference of 0.0%), Chilean (97.8%, a difference of 0.0%), and French American Indian (97.8%, a difference of 0.010%).
| Demographics | Rating | Rank | 3rd Grade |
| Venezuelans | 60.9 /100 | #158 | Good 97.8% |
| French American Indians | 60.0 /100 | #159 | Average 97.8% |
| Immigrants | Iran | 59.1 /100 | #160 | Average 97.8% |
| Albanians | 58.8 /100 | #161 | Average 97.8% |
| Immigrants | Jordan | 57.9 /100 | #162 | Average 97.8% |
| Marshallese | 57.2 /100 | #163 | Average 97.8% |
| Immigrants | Bosnia and Herzegovina | 56.2 /100 | #164 | Average 97.8% |
| Ugandans | 56.1 /100 | #165 | Average 97.8% |
| Dutch West Indians | 55.5 /100 | #166 | Average 97.8% |
| Chileans | 55.3 /100 | #167 | Average 97.8% |
| Immigrants | Spain | 54.3 /100 | #168 | Average 97.8% |
| Comanche | 53.8 /100 | #169 | Average 97.8% |
| Brazilians | 53.7 /100 | #170 | Average 97.8% |
| Kenyans | 51.8 /100 | #171 | Average 97.8% |
| Spanish Americans | 51.8 /100 | #172 | Average 97.8% |