Cree vs Immigrants from England 3rd Grade
COMPARE
Cree
Immigrants from England
3rd Grade
3rd Grade Comparison
Cree
Immigrants from England
98.1%
3RD GRADE
97.9/ 100
METRIC RATING
100th/ 347
METRIC RANK
98.2%
3RD GRADE
99.2/ 100
METRIC RATING
76th/ 347
METRIC RANK
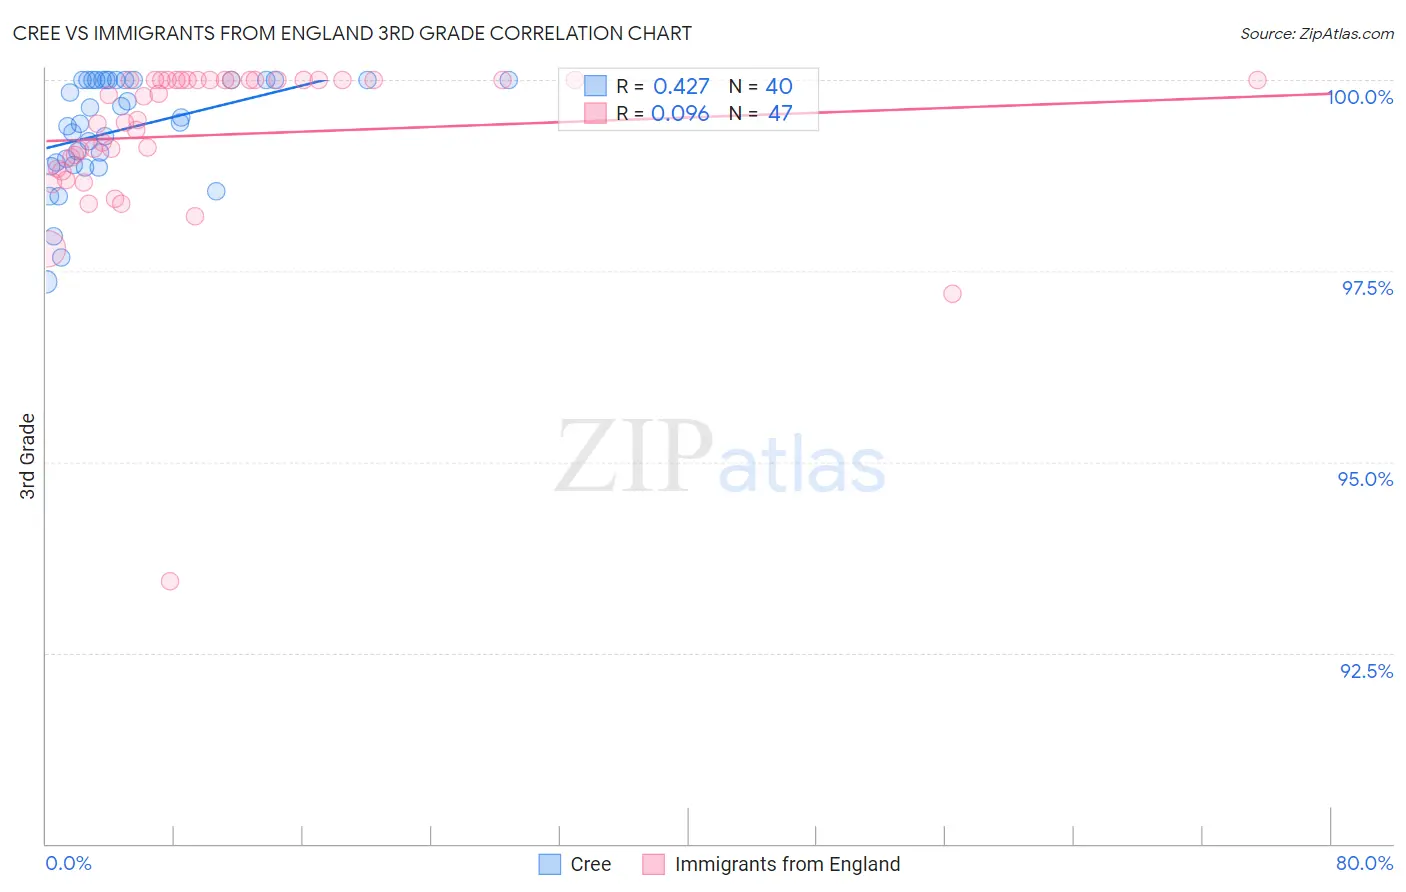
Cree vs Immigrants from England 3rd Grade Correlation Chart
The statistical analysis conducted on geographies consisting of 76,204,399 people shows a moderate positive correlation between the proportion of Cree and percentage of population with at least 3rd grade education in the United States with a correlation coefficient (R) of 0.427 and weighted average of 98.1%. Similarly, the statistical analysis conducted on geographies consisting of 391,898,018 people shows a slight positive correlation between the proportion of Immigrants from England and percentage of population with at least 3rd grade education in the United States with a correlation coefficient (R) of 0.096 and weighted average of 98.2%, a difference of 0.090%.
3rd Grade Correlation Summary
| Measurement | Cree | Immigrants from England |
| Minimum | 97.4% | 93.4% |
| Maximum | 100.0% | 100.0% |
| Range | 2.6% | 6.6% |
| Mean | 99.4% | 99.3% |
| Median | 99.5% | 99.8% |
| Interquartile 25% (IQ1) | 98.9% | 98.8% |
| Interquartile 75% (IQ3) | 100.0% | 100.0% |
| Interquartile Range (IQR) | 1.1% | 1.2% |
| Standard Deviation (Sample) | 0.70% | 1.1% |
| Standard Deviation (Population) | 0.69% | 1.1% |
Similar Demographics by 3rd Grade
Demographics Similar to Cree by 3rd Grade
In terms of 3rd grade, the demographic groups most similar to Cree are Choctaw (98.1%, a difference of 0.0%), Romanian (98.1%, a difference of 0.0%), Puget Sound Salish (98.1%, a difference of 0.0%), Nonimmigrants (98.1%, a difference of 0.0%), and Immigrants from Ireland (98.1%, a difference of 0.010%).
| Demographics | Rating | Rank | 3rd Grade |
| Immigrants | Western Europe | 98.7 /100 | #93 | Exceptional 98.1% |
| Immigrants | Germany | 98.4 /100 | #94 | Exceptional 98.1% |
| Cypriots | 98.4 /100 | #95 | Exceptional 98.1% |
| Immigrants | Ireland | 98.2 /100 | #96 | Exceptional 98.1% |
| South Africans | 98.2 /100 | #97 | Exceptional 98.1% |
| Choctaw | 98.0 /100 | #98 | Exceptional 98.1% |
| Romanians | 98.0 /100 | #99 | Exceptional 98.1% |
| Cree | 97.9 /100 | #100 | Exceptional 98.1% |
| Puget Sound Salish | 97.9 /100 | #101 | Exceptional 98.1% |
| Immigrants | Nonimmigrants | 97.8 /100 | #102 | Exceptional 98.1% |
| Yugoslavians | 97.7 /100 | #103 | Exceptional 98.1% |
| Turks | 97.6 /100 | #104 | Exceptional 98.1% |
| German Russians | 97.2 /100 | #105 | Exceptional 98.1% |
| Bhutanese | 97.2 /100 | #106 | Exceptional 98.1% |
| Immigrants | Czechoslovakia | 97.0 /100 | #107 | Exceptional 98.0% |
Demographics Similar to Immigrants from England by 3rd Grade
In terms of 3rd grade, the demographic groups most similar to Immigrants from England are Immigrants from Netherlands (98.2%, a difference of 0.0%), Cherokee (98.2%, a difference of 0.0%), Immigrants from Lithuania (98.2%, a difference of 0.0%), Cheyenne (98.2%, a difference of 0.010%), and Osage (98.2%, a difference of 0.010%).
| Demographics | Rating | Rank | 3rd Grade |
| Canadians | 99.6 /100 | #69 | Exceptional 98.2% |
| Cajuns | 99.6 /100 | #70 | Exceptional 98.2% |
| Immigrants | Austria | 99.6 /100 | #71 | Exceptional 98.2% |
| Chickasaw | 99.5 /100 | #72 | Exceptional 98.2% |
| Cheyenne | 99.3 /100 | #73 | Exceptional 98.2% |
| Immigrants | Netherlands | 99.3 /100 | #74 | Exceptional 98.2% |
| Cherokee | 99.3 /100 | #75 | Exceptional 98.2% |
| Immigrants | England | 99.2 /100 | #76 | Exceptional 98.2% |
| Immigrants | Lithuania | 99.2 /100 | #77 | Exceptional 98.2% |
| Osage | 99.2 /100 | #78 | Exceptional 98.2% |
| Immigrants | Belgium | 99.1 /100 | #79 | Exceptional 98.1% |
| Macedonians | 99.1 /100 | #80 | Exceptional 98.1% |
| Icelanders | 99.1 /100 | #81 | Exceptional 98.1% |
| Shoshone | 99.0 /100 | #82 | Exceptional 98.1% |
| Ukrainians | 98.9 /100 | #83 | Exceptional 98.1% |