Cree vs Ugandan Median Male Earnings
COMPARE
Cree
Ugandan
Median Male Earnings
Median Male Earnings Comparison
Cree
Ugandans
$49,497
MEDIAN MALE EARNINGS
0.7/ 100
METRIC RATING
258th/ 347
METRIC RANK
$55,290
MEDIAN MALE EARNINGS
68.6/ 100
METRIC RATING
163rd/ 347
METRIC RANK
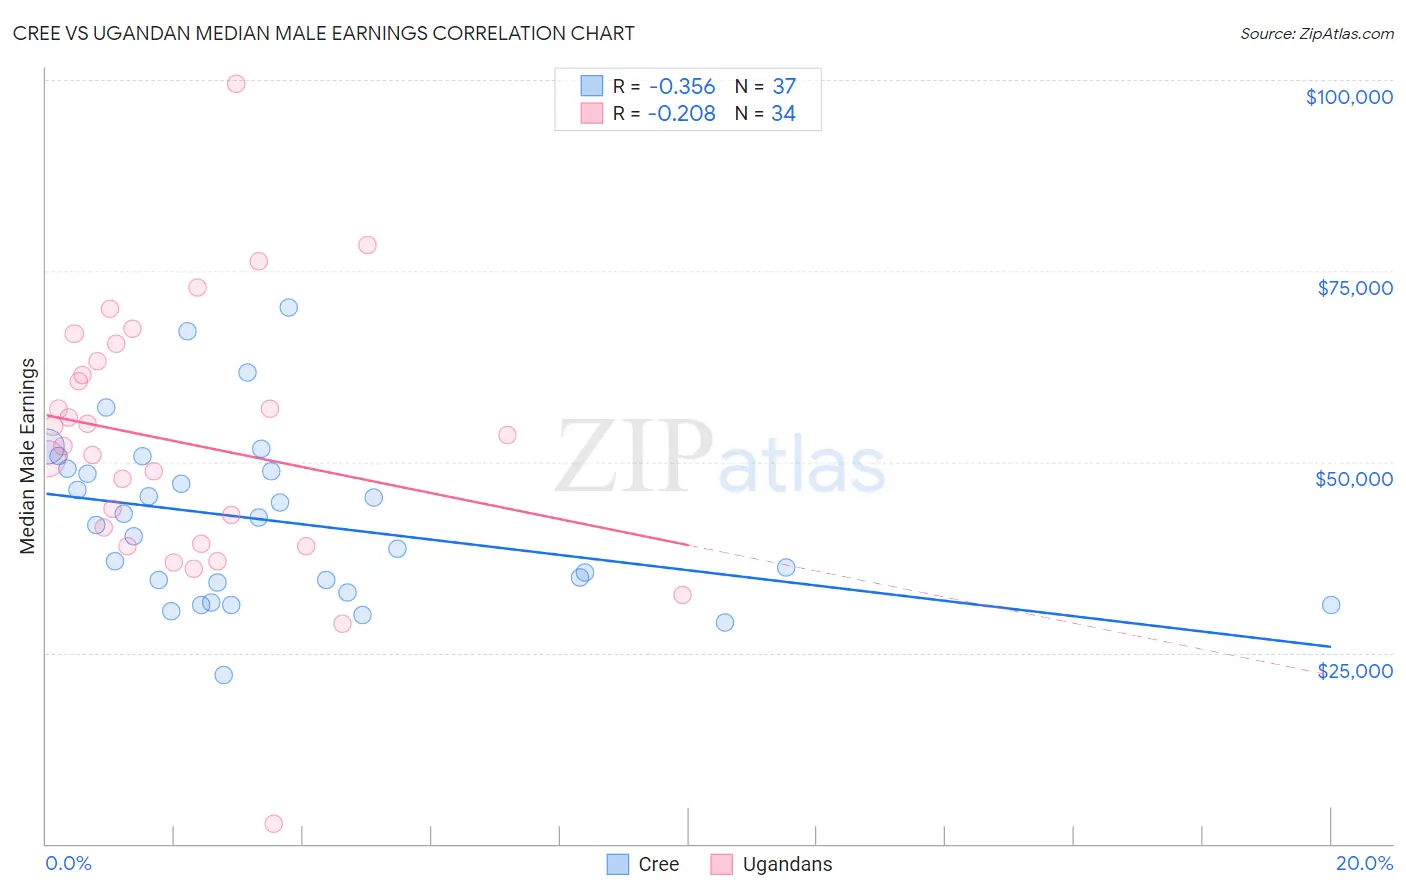
Cree vs Ugandan Median Male Earnings Correlation Chart
The statistical analysis conducted on geographies consisting of 76,198,776 people shows a mild negative correlation between the proportion of Cree and median male earnings in the United States with a correlation coefficient (R) of -0.356 and weighted average of $49,497. Similarly, the statistical analysis conducted on geographies consisting of 94,009,031 people shows a weak negative correlation between the proportion of Ugandans and median male earnings in the United States with a correlation coefficient (R) of -0.208 and weighted average of $55,290, a difference of 11.7%.
Median Male Earnings Correlation Summary
| Measurement | Cree | Ugandan |
| Minimum | $22,163 | $2,614 |
| Maximum | $70,294 | $99,574 |
| Range | $48,131 | $96,960 |
| Mean | $42,158 | $52,480 |
| Median | $41,730 | $52,840 |
| Interquartile 25% (IQ1) | $33,580 | $39,217 |
| Interquartile 75% (IQ3) | $48,892 | $63,193 |
| Interquartile Range (IQR) | $15,312 | $23,975 |
| Standard Deviation (Sample) | $10,951 | $17,547 |
| Standard Deviation (Population) | $10,802 | $17,287 |
Similar Demographics by Median Male Earnings
Demographics Similar to Cree by Median Male Earnings
In terms of median male earnings, the demographic groups most similar to Cree are Nepalese ($49,458, a difference of 0.080%), Iroquois ($49,374, a difference of 0.25%), British West Indian ($49,636, a difference of 0.28%), Liberian ($49,318, a difference of 0.36%), and Alaska Native ($49,711, a difference of 0.43%).
| Demographics | Rating | Rank | Median Male Earnings |
| Immigrants | Grenada | 1.6 /100 | #251 | Tragic $50,279 |
| Immigrants | Cabo Verde | 1.2 /100 | #252 | Tragic $50,009 |
| German Russians | 1.1 /100 | #253 | Tragic $49,924 |
| Senegalese | 1.0 /100 | #254 | Tragic $49,774 |
| Alaskan Athabascans | 0.9 /100 | #255 | Tragic $49,748 |
| Alaska Natives | 0.9 /100 | #256 | Tragic $49,711 |
| British West Indians | 0.8 /100 | #257 | Tragic $49,636 |
| Cree | 0.7 /100 | #258 | Tragic $49,497 |
| Nepalese | 0.7 /100 | #259 | Tragic $49,458 |
| Iroquois | 0.7 /100 | #260 | Tragic $49,374 |
| Liberians | 0.6 /100 | #261 | Tragic $49,318 |
| Immigrants | West Indies | 0.6 /100 | #262 | Tragic $49,271 |
| Nicaraguans | 0.6 /100 | #263 | Tragic $49,215 |
| Immigrants | Middle Africa | 0.6 /100 | #264 | Tragic $49,201 |
| Immigrants | Laos | 0.6 /100 | #265 | Tragic $49,190 |
Demographics Similar to Ugandans by Median Male Earnings
In terms of median male earnings, the demographic groups most similar to Ugandans are Immigrants from South Eastern Asia ($55,241, a difference of 0.090%), French ($55,350, a difference of 0.11%), Belgian ($55,361, a difference of 0.13%), Basque ($55,370, a difference of 0.15%), and Alsatian ($55,380, a difference of 0.16%).
| Demographics | Rating | Rank | Median Male Earnings |
| Immigrants | Ethiopia | 71.6 /100 | #156 | Good $55,434 |
| Icelanders | 71.2 /100 | #157 | Good $55,415 |
| Czechoslovakians | 70.5 /100 | #158 | Good $55,382 |
| Alsatians | 70.5 /100 | #159 | Good $55,380 |
| Basques | 70.3 /100 | #160 | Good $55,370 |
| Belgians | 70.1 /100 | #161 | Good $55,361 |
| French | 69.9 /100 | #162 | Good $55,350 |
| Ugandans | 68.6 /100 | #163 | Good $55,290 |
| Immigrants | South Eastern Asia | 67.6 /100 | #164 | Good $55,241 |
| Immigrants | Portugal | 66.3 /100 | #165 | Good $55,182 |
| Germans | 61.6 /100 | #166 | Good $54,974 |
| Immigrants | Fiji | 61.2 /100 | #167 | Good $54,958 |
| Immigrants | Vietnam | 60.2 /100 | #168 | Good $54,913 |
| French Canadians | 55.6 /100 | #169 | Average $54,722 |
| Finns | 55.6 /100 | #170 | Average $54,721 |