Immigrants from Taiwan vs Ugandan 3rd Grade
COMPARE
Immigrants from Taiwan
Ugandan
3rd Grade
3rd Grade Comparison
Immigrants from Taiwan
Ugandans
97.7%
3RD GRADE
34.2/ 100
METRIC RATING
188th/ 347
METRIC RANK
97.8%
3RD GRADE
56.1/ 100
METRIC RATING
165th/ 347
METRIC RANK
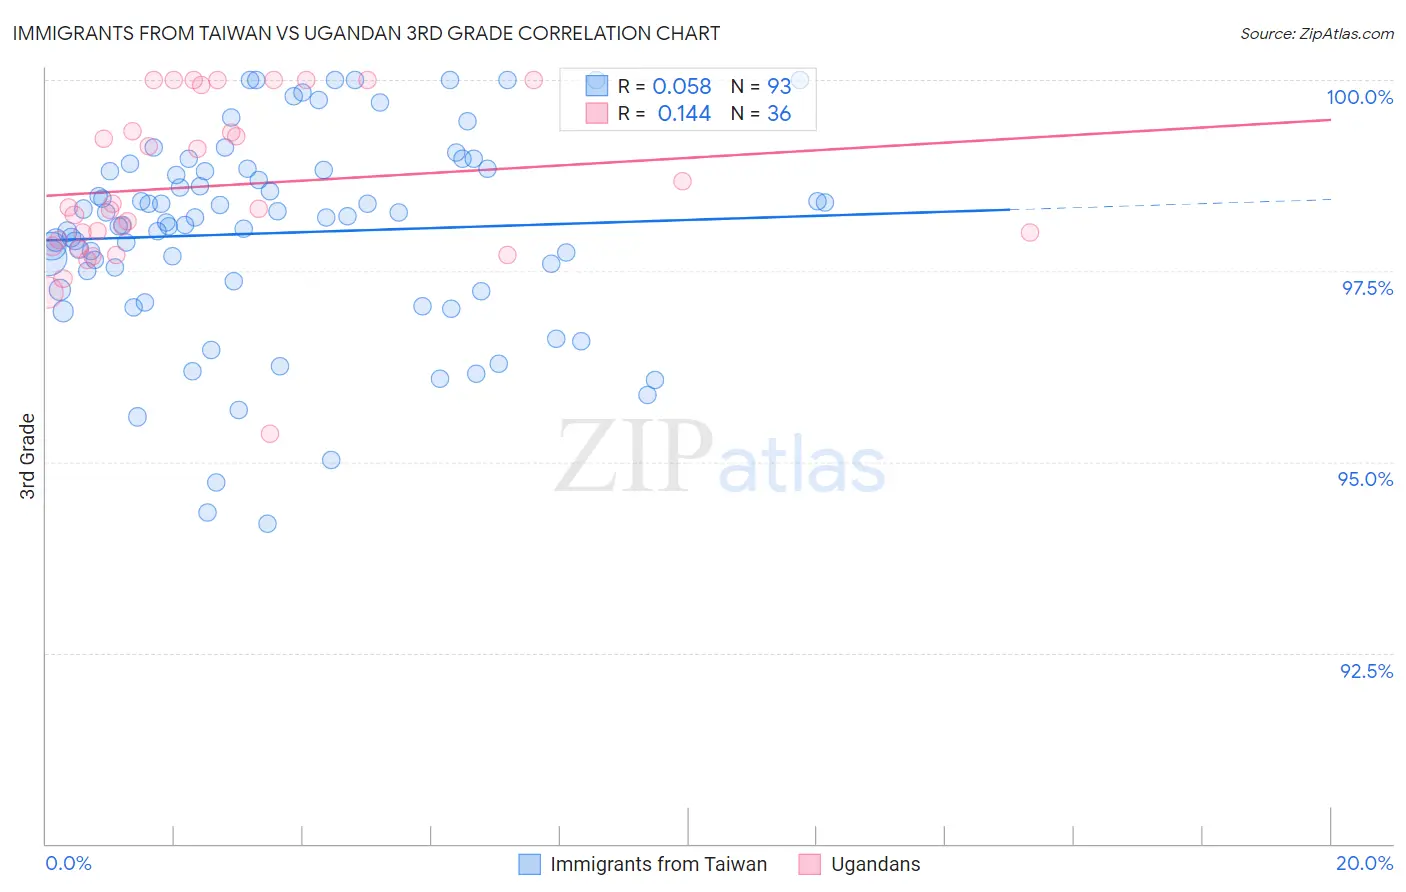
Immigrants from Taiwan vs Ugandan 3rd Grade Correlation Chart
The statistical analysis conducted on geographies consisting of 298,069,082 people shows a slight positive correlation between the proportion of Immigrants from Taiwan and percentage of population with at least 3rd grade education in the United States with a correlation coefficient (R) of 0.058 and weighted average of 97.7%. Similarly, the statistical analysis conducted on geographies consisting of 93,991,892 people shows a poor positive correlation between the proportion of Ugandans and percentage of population with at least 3rd grade education in the United States with a correlation coefficient (R) of 0.144 and weighted average of 97.8%, a difference of 0.080%.
3rd Grade Correlation Summary
| Measurement | Immigrants from Taiwan | Ugandan |
| Minimum | 94.2% | 95.4% |
| Maximum | 100.0% | 100.0% |
| Range | 5.8% | 4.6% |
| Mean | 98.0% | 98.6% |
| Median | 98.2% | 98.3% |
| Interquartile 25% (IQ1) | 97.3% | 97.9% |
| Interquartile 75% (IQ3) | 98.8% | 99.6% |
| Interquartile Range (IQR) | 1.5% | 1.8% |
| Standard Deviation (Sample) | 1.3% | 1.1% |
| Standard Deviation (Population) | 1.3% | 1.1% |
Similar Demographics by 3rd Grade
Demographics Similar to Immigrants from Taiwan by 3rd Grade
In terms of 3rd grade, the demographic groups most similar to Immigrants from Taiwan are Native/Alaskan (97.7%, a difference of 0.0%), Pakistani (97.7%, a difference of 0.0%), Immigrants from Kazakhstan (97.7%, a difference of 0.010%), Immigrants from Argentina (97.7%, a difference of 0.010%), and Portuguese (97.7%, a difference of 0.010%).
| Demographics | Rating | Rank | 3rd Grade |
| Immigrants | Venezuela | 44.4 /100 | #181 | Average 97.7% |
| Argentineans | 42.9 /100 | #182 | Average 97.7% |
| Arabs | 40.0 /100 | #183 | Fair 97.7% |
| Immigrants | Kazakhstan | 37.4 /100 | #184 | Fair 97.7% |
| Immigrants | Argentina | 37.0 /100 | #185 | Fair 97.7% |
| Portuguese | 36.2 /100 | #186 | Fair 97.7% |
| Natives/Alaskans | 35.2 /100 | #187 | Fair 97.7% |
| Immigrants | Taiwan | 34.2 /100 | #188 | Fair 97.7% |
| Pakistanis | 34.2 /100 | #189 | Fair 97.7% |
| Panamanians | 31.5 /100 | #190 | Fair 97.7% |
| Blacks/African Americans | 29.6 /100 | #191 | Fair 97.7% |
| Mongolians | 29.1 /100 | #192 | Fair 97.7% |
| Immigrants | Kenya | 28.2 /100 | #193 | Fair 97.7% |
| Immigrants | Uganda | 27.4 /100 | #194 | Fair 97.7% |
| Immigrants | Egypt | 26.8 /100 | #195 | Fair 97.7% |
Demographics Similar to Ugandans by 3rd Grade
In terms of 3rd grade, the demographic groups most similar to Ugandans are Marshallese (97.8%, a difference of 0.0%), Immigrants from Bosnia and Herzegovina (97.8%, a difference of 0.0%), Dutch West Indian (97.8%, a difference of 0.0%), Chilean (97.8%, a difference of 0.0%), and French American Indian (97.8%, a difference of 0.010%).
| Demographics | Rating | Rank | 3rd Grade |
| Venezuelans | 60.9 /100 | #158 | Good 97.8% |
| French American Indians | 60.0 /100 | #159 | Average 97.8% |
| Immigrants | Iran | 59.1 /100 | #160 | Average 97.8% |
| Albanians | 58.8 /100 | #161 | Average 97.8% |
| Immigrants | Jordan | 57.9 /100 | #162 | Average 97.8% |
| Marshallese | 57.2 /100 | #163 | Average 97.8% |
| Immigrants | Bosnia and Herzegovina | 56.2 /100 | #164 | Average 97.8% |
| Ugandans | 56.1 /100 | #165 | Average 97.8% |
| Dutch West Indians | 55.5 /100 | #166 | Average 97.8% |
| Chileans | 55.3 /100 | #167 | Average 97.8% |
| Immigrants | Spain | 54.3 /100 | #168 | Average 97.8% |
| Comanche | 53.8 /100 | #169 | Average 97.8% |
| Brazilians | 53.7 /100 | #170 | Average 97.8% |
| Kenyans | 51.8 /100 | #171 | Average 97.8% |
| Spanish Americans | 51.8 /100 | #172 | Average 97.8% |