Senegalese vs Ugandan 3rd Grade
COMPARE
Senegalese
Ugandan
3rd Grade
3rd Grade Comparison
Senegalese
Ugandans
97.5%
3RD GRADE
3.0/ 100
METRIC RATING
229th/ 347
METRIC RANK
97.8%
3RD GRADE
56.1/ 100
METRIC RATING
165th/ 347
METRIC RANK
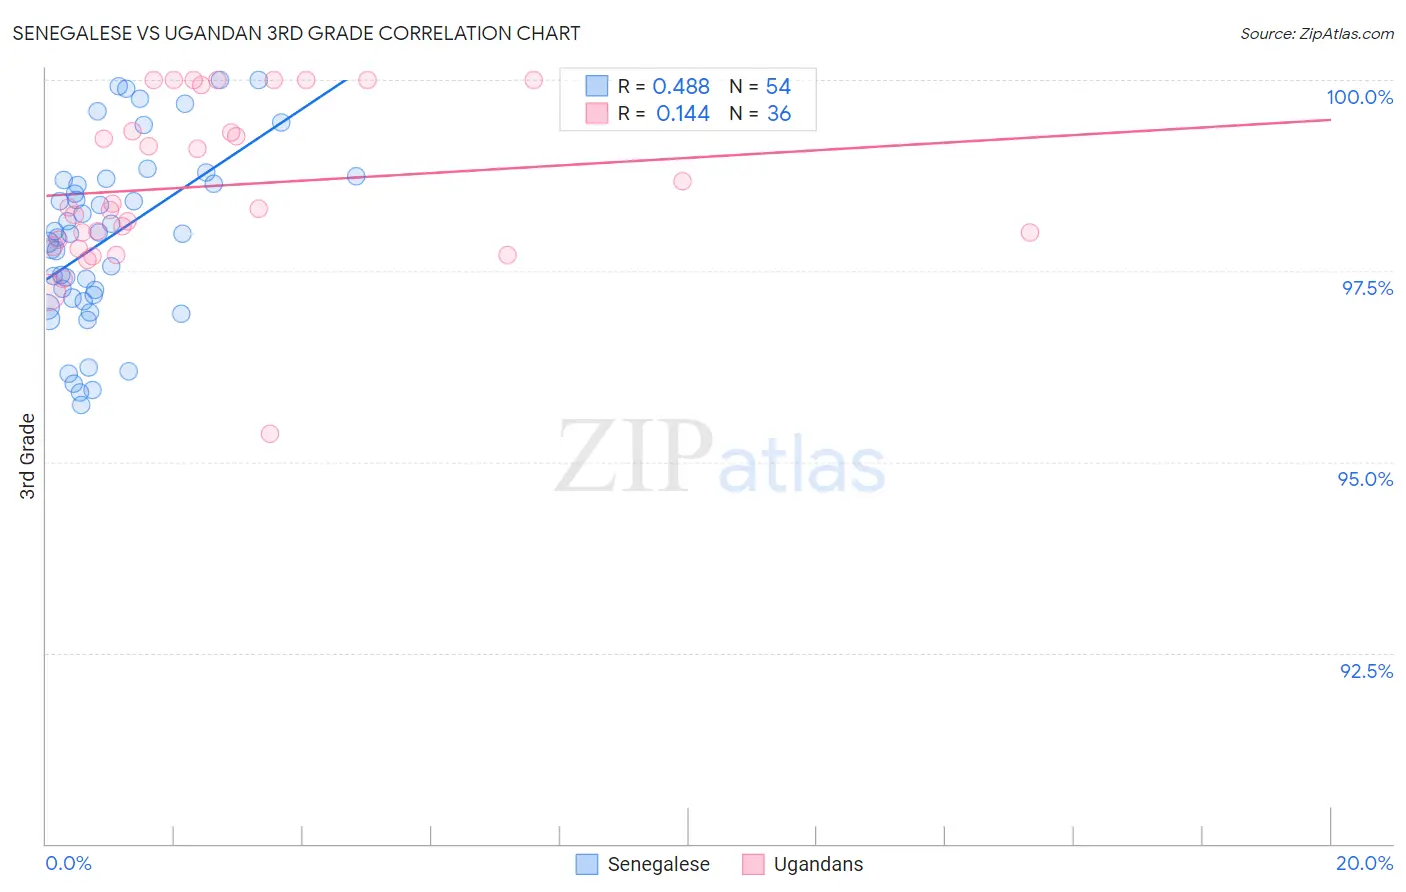
Senegalese vs Ugandan 3rd Grade Correlation Chart
The statistical analysis conducted on geographies consisting of 78,142,569 people shows a moderate positive correlation between the proportion of Senegalese and percentage of population with at least 3rd grade education in the United States with a correlation coefficient (R) of 0.488 and weighted average of 97.5%. Similarly, the statistical analysis conducted on geographies consisting of 93,991,892 people shows a poor positive correlation between the proportion of Ugandans and percentage of population with at least 3rd grade education in the United States with a correlation coefficient (R) of 0.144 and weighted average of 97.8%, a difference of 0.32%.
3rd Grade Correlation Summary
| Measurement | Senegalese | Ugandan |
| Minimum | 95.7% | 95.4% |
| Maximum | 100.0% | 100.0% |
| Range | 4.3% | 4.6% |
| Mean | 97.9% | 98.6% |
| Median | 98.0% | 98.3% |
| Interquartile 25% (IQ1) | 97.1% | 97.9% |
| Interquartile 75% (IQ3) | 98.7% | 99.6% |
| Interquartile Range (IQR) | 1.6% | 1.8% |
| Standard Deviation (Sample) | 1.2% | 1.1% |
| Standard Deviation (Population) | 1.1% | 1.1% |
Similar Demographics by 3rd Grade
Demographics Similar to Senegalese by 3rd Grade
In terms of 3rd grade, the demographic groups most similar to Senegalese are Immigrants from Sudan (97.5%, a difference of 0.010%), Subsaharan African (97.5%, a difference of 0.010%), Immigrants from Pakistan (97.5%, a difference of 0.010%), Immigrants from Costa Rica (97.5%, a difference of 0.010%), and Immigrants from Western Asia (97.5%, a difference of 0.010%).
| Demographics | Rating | Rank | 3rd Grade |
| Sierra Leoneans | 4.6 /100 | #222 | Tragic 97.5% |
| Immigrants | Syria | 4.4 /100 | #223 | Tragic 97.5% |
| Bahamians | 4.4 /100 | #224 | Tragic 97.5% |
| Tongans | 4.3 /100 | #225 | Tragic 97.5% |
| Sudanese | 4.1 /100 | #226 | Tragic 97.5% |
| Immigrants | Sudan | 3.4 /100 | #227 | Tragic 97.5% |
| Sub-Saharan Africans | 3.2 /100 | #228 | Tragic 97.5% |
| Senegalese | 3.0 /100 | #229 | Tragic 97.5% |
| Immigrants | Pakistan | 2.7 /100 | #230 | Tragic 97.5% |
| Immigrants | Costa Rica | 2.7 /100 | #231 | Tragic 97.5% |
| Immigrants | Western Asia | 2.6 /100 | #232 | Tragic 97.5% |
| Immigrants | Malaysia | 2.4 /100 | #233 | Tragic 97.5% |
| Immigrants | Eastern Asia | 1.9 /100 | #234 | Tragic 97.4% |
| Immigrants | Iraq | 1.8 /100 | #235 | Tragic 97.4% |
| Liberians | 1.8 /100 | #236 | Tragic 97.4% |
Demographics Similar to Ugandans by 3rd Grade
In terms of 3rd grade, the demographic groups most similar to Ugandans are Marshallese (97.8%, a difference of 0.0%), Immigrants from Bosnia and Herzegovina (97.8%, a difference of 0.0%), Dutch West Indian (97.8%, a difference of 0.0%), Chilean (97.8%, a difference of 0.0%), and French American Indian (97.8%, a difference of 0.010%).
| Demographics | Rating | Rank | 3rd Grade |
| Venezuelans | 60.9 /100 | #158 | Good 97.8% |
| French American Indians | 60.0 /100 | #159 | Average 97.8% |
| Immigrants | Iran | 59.1 /100 | #160 | Average 97.8% |
| Albanians | 58.8 /100 | #161 | Average 97.8% |
| Immigrants | Jordan | 57.9 /100 | #162 | Average 97.8% |
| Marshallese | 57.2 /100 | #163 | Average 97.8% |
| Immigrants | Bosnia and Herzegovina | 56.2 /100 | #164 | Average 97.8% |
| Ugandans | 56.1 /100 | #165 | Average 97.8% |
| Dutch West Indians | 55.5 /100 | #166 | Average 97.8% |
| Chileans | 55.3 /100 | #167 | Average 97.8% |
| Immigrants | Spain | 54.3 /100 | #168 | Average 97.8% |
| Comanche | 53.8 /100 | #169 | Average 97.8% |
| Brazilians | 53.7 /100 | #170 | Average 97.8% |
| Kenyans | 51.8 /100 | #171 | Average 97.8% |
| Spanish Americans | 51.8 /100 | #172 | Average 97.8% |