Cree vs Somali 3rd Grade
COMPARE
Cree
Somali
3rd Grade
3rd Grade Comparison
Cree
Somalis
98.1%
3RD GRADE
97.9/ 100
METRIC RATING
100th/ 347
METRIC RANK
96.8%
3RD GRADE
0.0/ 100
METRIC RATING
299th/ 347
METRIC RANK
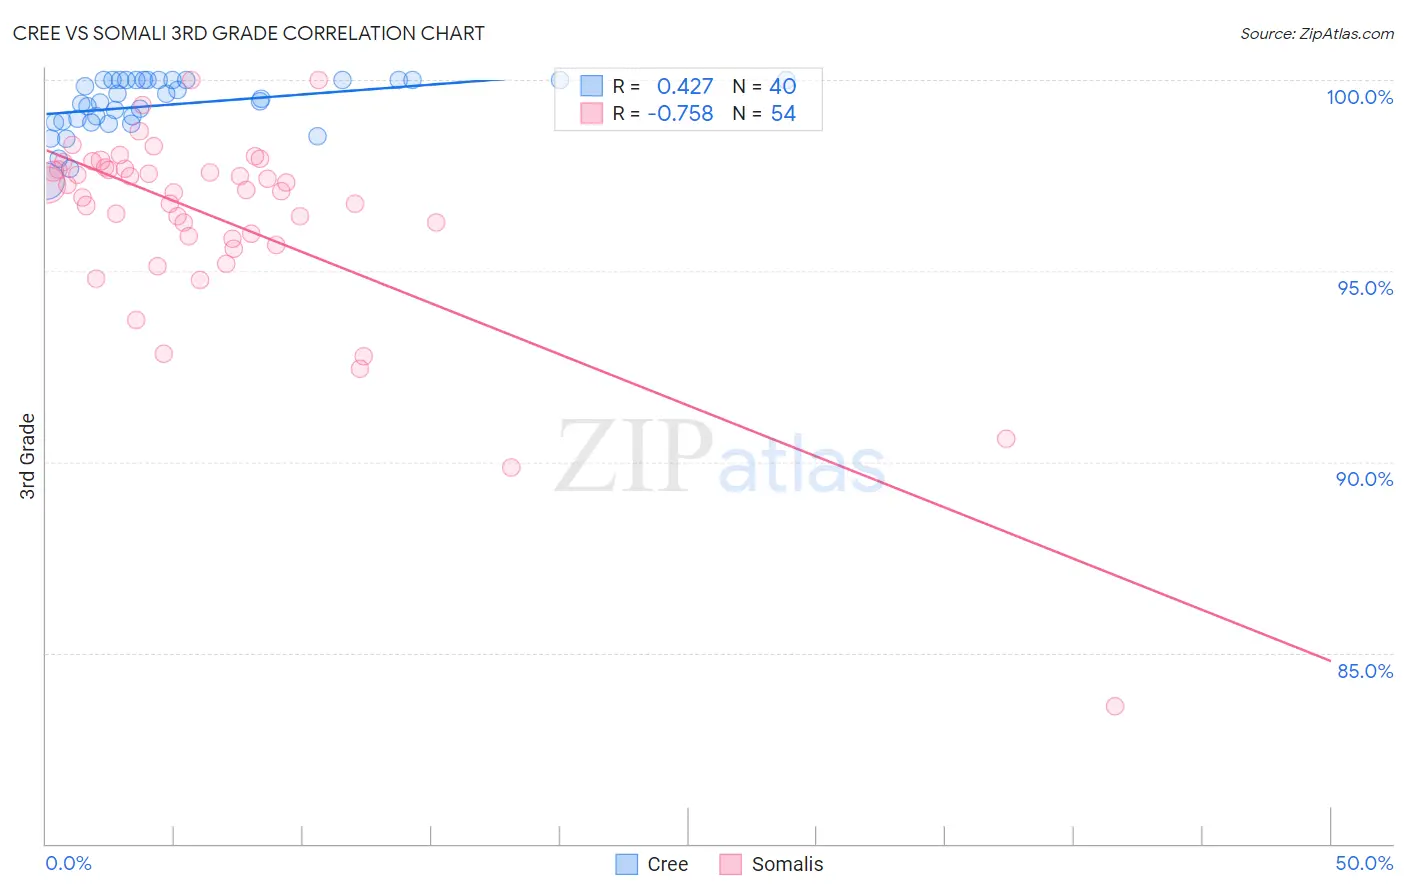
Cree vs Somali 3rd Grade Correlation Chart
The statistical analysis conducted on geographies consisting of 76,204,399 people shows a moderate positive correlation between the proportion of Cree and percentage of population with at least 3rd grade education in the United States with a correlation coefficient (R) of 0.427 and weighted average of 98.1%. Similarly, the statistical analysis conducted on geographies consisting of 99,332,457 people shows a strong negative correlation between the proportion of Somalis and percentage of population with at least 3rd grade education in the United States with a correlation coefficient (R) of -0.758 and weighted average of 96.8%, a difference of 1.3%.
3rd Grade Correlation Summary
| Measurement | Cree | Somali |
| Minimum | 97.4% | 83.6% |
| Maximum | 100.0% | 100.0% |
| Range | 2.6% | 16.4% |
| Mean | 99.4% | 96.3% |
| Median | 99.5% | 97.1% |
| Interquartile 25% (IQ1) | 98.9% | 95.8% |
| Interquartile 75% (IQ3) | 100.0% | 97.7% |
| Interquartile Range (IQR) | 1.1% | 1.8% |
| Standard Deviation (Sample) | 0.70% | 2.7% |
| Standard Deviation (Population) | 0.69% | 2.7% |
Similar Demographics by 3rd Grade
Demographics Similar to Cree by 3rd Grade
In terms of 3rd grade, the demographic groups most similar to Cree are Choctaw (98.1%, a difference of 0.0%), Romanian (98.1%, a difference of 0.0%), Puget Sound Salish (98.1%, a difference of 0.0%), Nonimmigrants (98.1%, a difference of 0.0%), and Immigrants from Ireland (98.1%, a difference of 0.010%).
| Demographics | Rating | Rank | 3rd Grade |
| Immigrants | Western Europe | 98.7 /100 | #93 | Exceptional 98.1% |
| Immigrants | Germany | 98.4 /100 | #94 | Exceptional 98.1% |
| Cypriots | 98.4 /100 | #95 | Exceptional 98.1% |
| Immigrants | Ireland | 98.2 /100 | #96 | Exceptional 98.1% |
| South Africans | 98.2 /100 | #97 | Exceptional 98.1% |
| Choctaw | 98.0 /100 | #98 | Exceptional 98.1% |
| Romanians | 98.0 /100 | #99 | Exceptional 98.1% |
| Cree | 97.9 /100 | #100 | Exceptional 98.1% |
| Puget Sound Salish | 97.9 /100 | #101 | Exceptional 98.1% |
| Immigrants | Nonimmigrants | 97.8 /100 | #102 | Exceptional 98.1% |
| Yugoslavians | 97.7 /100 | #103 | Exceptional 98.1% |
| Turks | 97.6 /100 | #104 | Exceptional 98.1% |
| German Russians | 97.2 /100 | #105 | Exceptional 98.1% |
| Bhutanese | 97.2 /100 | #106 | Exceptional 98.1% |
| Immigrants | Czechoslovakia | 97.0 /100 | #107 | Exceptional 98.0% |
Demographics Similar to Somalis by 3rd Grade
In terms of 3rd grade, the demographic groups most similar to Somalis are Immigrants from Dominica (96.9%, a difference of 0.010%), Immigrants from South Eastern Asia (96.8%, a difference of 0.010%), Haitian (96.9%, a difference of 0.020%), Immigrants from Cuba (96.8%, a difference of 0.020%), and Immigrants (96.9%, a difference of 0.040%).
| Demographics | Rating | Rank | 3rd Grade |
| British West Indians | 0.0 /100 | #292 | Tragic 97.0% |
| Immigrants | Grenada | 0.0 /100 | #293 | Tragic 97.0% |
| Malaysians | 0.0 /100 | #294 | Tragic 97.0% |
| Immigrants | Eritrea | 0.0 /100 | #295 | Tragic 97.0% |
| Immigrants | Immigrants | 0.0 /100 | #296 | Tragic 96.9% |
| Haitians | 0.0 /100 | #297 | Tragic 96.9% |
| Immigrants | Dominica | 0.0 /100 | #298 | Tragic 96.9% |
| Somalis | 0.0 /100 | #299 | Tragic 96.8% |
| Immigrants | South Eastern Asia | 0.0 /100 | #300 | Tragic 96.8% |
| Immigrants | Cuba | 0.0 /100 | #301 | Tragic 96.8% |
| Immigrants | Somalia | 0.0 /100 | #302 | Tragic 96.8% |
| Ecuadorians | 0.0 /100 | #303 | Tragic 96.7% |
| Immigrants | Caribbean | 0.0 /100 | #304 | Tragic 96.7% |
| Central American Indians | 0.0 /100 | #305 | Tragic 96.7% |
| Guyanese | 0.0 /100 | #306 | Tragic 96.7% |