Cree vs Irish 3rd Grade
COMPARE
Cree
Irish
3rd Grade
3rd Grade Comparison
Cree
Irish
98.1%
3RD GRADE
97.9/ 100
METRIC RATING
100th/ 347
METRIC RANK
98.5%
3RD GRADE
100.0/ 100
METRIC RATING
18th/ 347
METRIC RANK
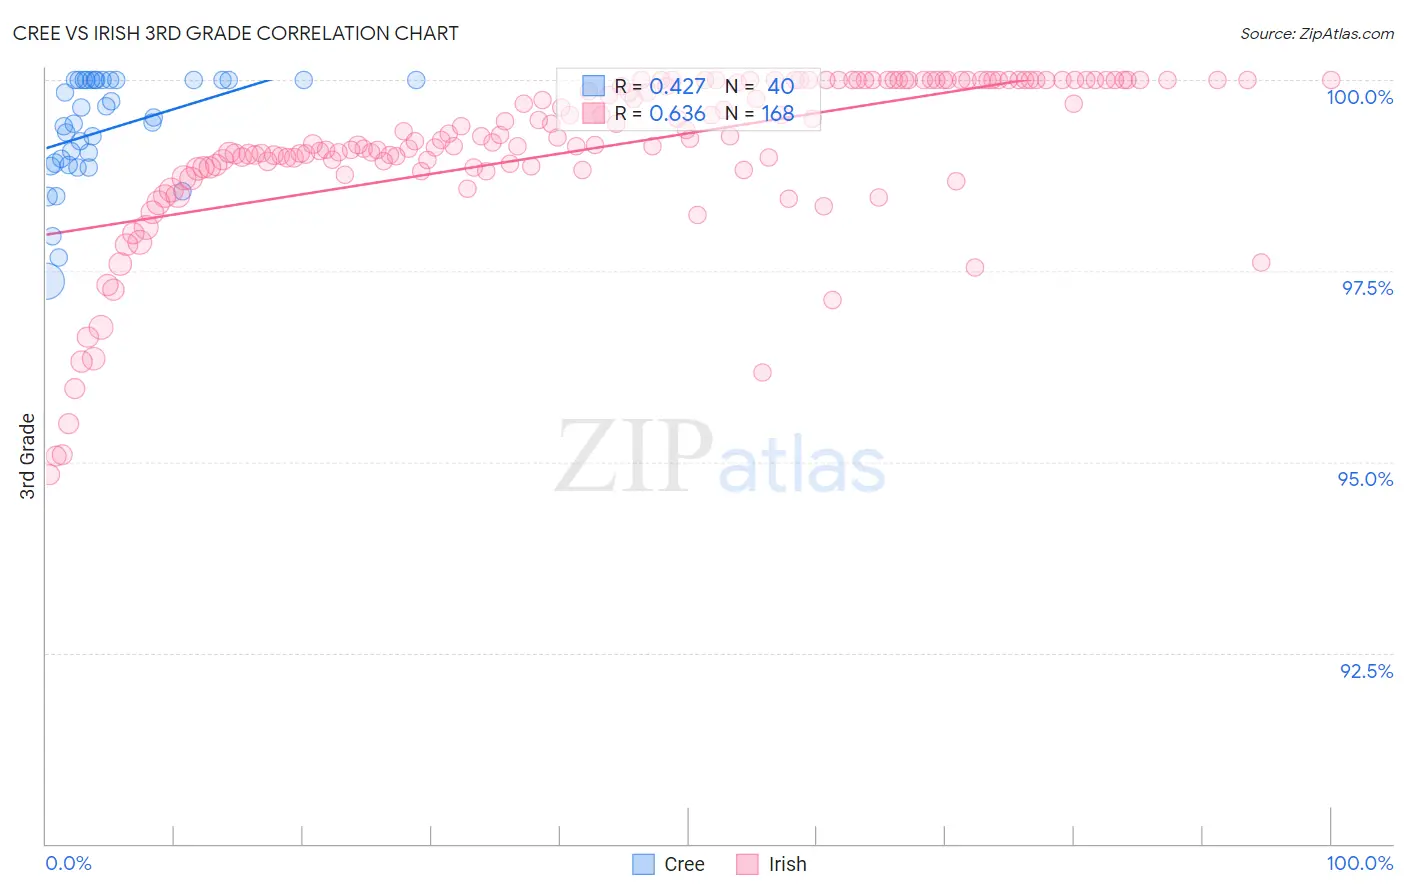
Cree vs Irish 3rd Grade Correlation Chart
The statistical analysis conducted on geographies consisting of 76,204,399 people shows a moderate positive correlation between the proportion of Cree and percentage of population with at least 3rd grade education in the United States with a correlation coefficient (R) of 0.427 and weighted average of 98.1%. Similarly, the statistical analysis conducted on geographies consisting of 580,708,963 people shows a significant positive correlation between the proportion of Irish and percentage of population with at least 3rd grade education in the United States with a correlation coefficient (R) of 0.636 and weighted average of 98.5%, a difference of 0.43%.
3rd Grade Correlation Summary
| Measurement | Cree | Irish |
| Minimum | 97.4% | 94.8% |
| Maximum | 100.0% | 100.0% |
| Range | 2.6% | 5.2% |
| Mean | 99.4% | 99.1% |
| Median | 99.5% | 99.2% |
| Interquartile 25% (IQ1) | 98.9% | 98.9% |
| Interquartile 75% (IQ3) | 100.0% | 100.0% |
| Interquartile Range (IQR) | 1.1% | 1.1% |
| Standard Deviation (Sample) | 0.70% | 1.1% |
| Standard Deviation (Population) | 0.69% | 1.1% |
Similar Demographics by 3rd Grade
Demographics Similar to Cree by 3rd Grade
In terms of 3rd grade, the demographic groups most similar to Cree are Choctaw (98.1%, a difference of 0.0%), Romanian (98.1%, a difference of 0.0%), Puget Sound Salish (98.1%, a difference of 0.0%), Nonimmigrants (98.1%, a difference of 0.0%), and Immigrants from Ireland (98.1%, a difference of 0.010%).
| Demographics | Rating | Rank | 3rd Grade |
| Immigrants | Western Europe | 98.7 /100 | #93 | Exceptional 98.1% |
| Immigrants | Germany | 98.4 /100 | #94 | Exceptional 98.1% |
| Cypriots | 98.4 /100 | #95 | Exceptional 98.1% |
| Immigrants | Ireland | 98.2 /100 | #96 | Exceptional 98.1% |
| South Africans | 98.2 /100 | #97 | Exceptional 98.1% |
| Choctaw | 98.0 /100 | #98 | Exceptional 98.1% |
| Romanians | 98.0 /100 | #99 | Exceptional 98.1% |
| Cree | 97.9 /100 | #100 | Exceptional 98.1% |
| Puget Sound Salish | 97.9 /100 | #101 | Exceptional 98.1% |
| Immigrants | Nonimmigrants | 97.8 /100 | #102 | Exceptional 98.1% |
| Yugoslavians | 97.7 /100 | #103 | Exceptional 98.1% |
| Turks | 97.6 /100 | #104 | Exceptional 98.1% |
| German Russians | 97.2 /100 | #105 | Exceptional 98.1% |
| Bhutanese | 97.2 /100 | #106 | Exceptional 98.1% |
| Immigrants | Czechoslovakia | 97.0 /100 | #107 | Exceptional 98.0% |
Demographics Similar to Irish by 3rd Grade
In terms of 3rd grade, the demographic groups most similar to Irish are Dutch (98.5%, a difference of 0.010%), Polish (98.5%, a difference of 0.010%), Pennsylvania German (98.5%, a difference of 0.010%), Lithuanian (98.5%, a difference of 0.010%), and Scottish (98.5%, a difference of 0.020%).
| Demographics | Rating | Rank | 3rd Grade |
| Slovenes | 100.0 /100 | #11 | Exceptional 98.6% |
| English | 100.0 /100 | #12 | Exceptional 98.6% |
| Tlingit-Haida | 100.0 /100 | #13 | Exceptional 98.5% |
| Carpatho Rusyns | 100.0 /100 | #14 | Exceptional 98.5% |
| Swedes | 100.0 /100 | #15 | Exceptional 98.5% |
| Scottish | 100.0 /100 | #16 | Exceptional 98.5% |
| Dutch | 100.0 /100 | #17 | Exceptional 98.5% |
| Irish | 100.0 /100 | #18 | Exceptional 98.5% |
| Poles | 100.0 /100 | #19 | Exceptional 98.5% |
| Pennsylvania Germans | 100.0 /100 | #20 | Exceptional 98.5% |
| Lithuanians | 100.0 /100 | #21 | Exceptional 98.5% |
| Finns | 100.0 /100 | #22 | Exceptional 98.5% |
| Sioux | 100.0 /100 | #23 | Exceptional 98.5% |
| Danes | 100.0 /100 | #24 | Exceptional 98.5% |
| Scotch-Irish | 100.0 /100 | #25 | Exceptional 98.5% |