Cree vs Ugandan In Labor Force | Age > 16
COMPARE
Cree
Ugandan
In Labor Force | Age > 16
In Labor Force | Age > 16 Comparison
Cree
Ugandans
63.5%
IN LABOR FORCE | AGE > 16
0.0/ 100
METRIC RATING
303rd/ 347
METRIC RANK
67.4%
IN LABOR FORCE | AGE > 16
100.0/ 100
METRIC RATING
24th/ 347
METRIC RANK
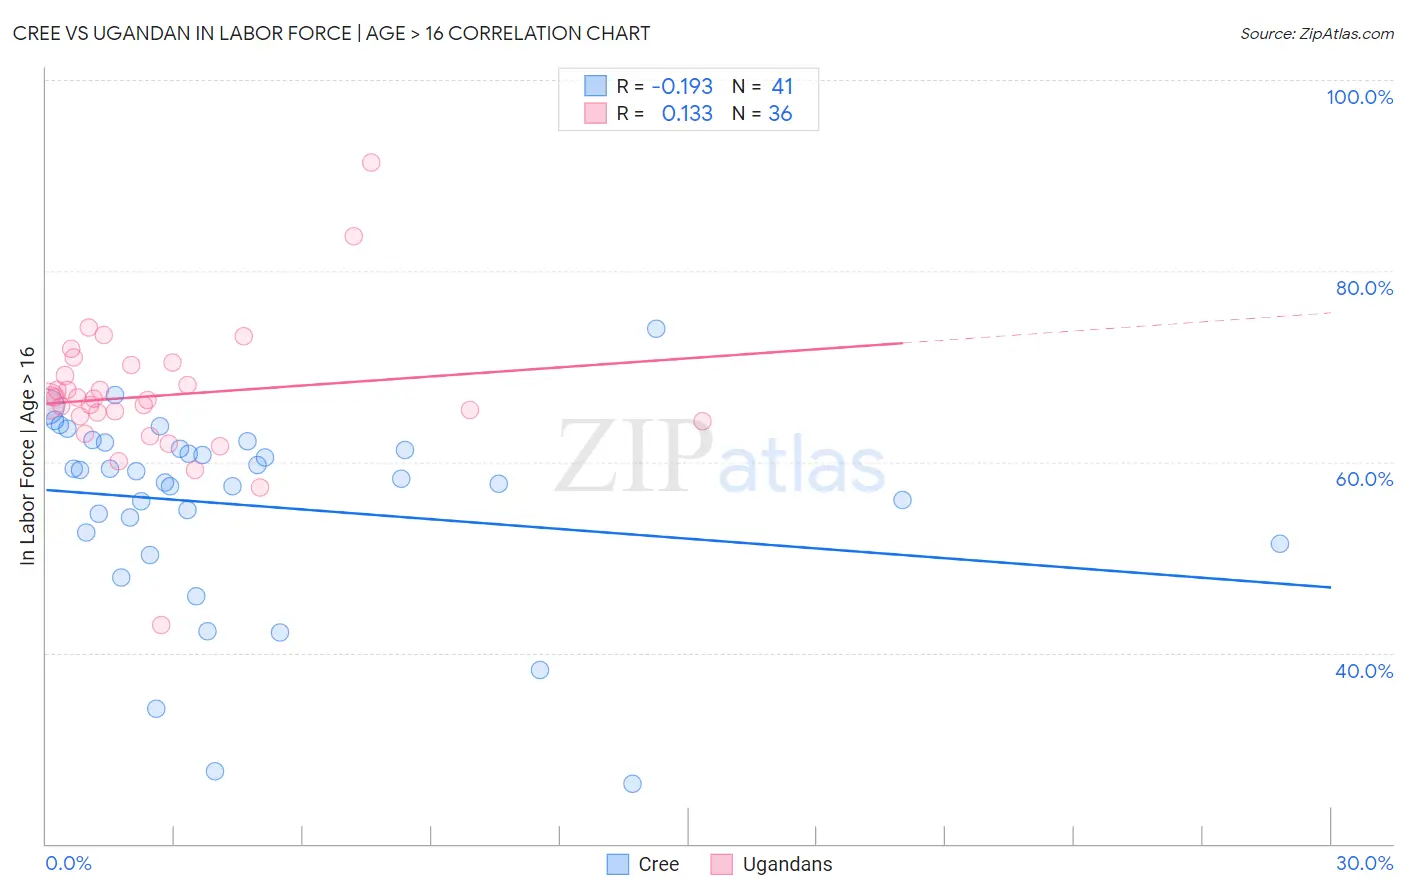
Cree vs Ugandan In Labor Force | Age > 16 Correlation Chart
The statistical analysis conducted on geographies consisting of 76,210,691 people shows a poor negative correlation between the proportion of Cree and labor force participation rate among population ages 16 and over in the United States with a correlation coefficient (R) of -0.193 and weighted average of 63.5%. Similarly, the statistical analysis conducted on geographies consisting of 94,018,069 people shows a poor positive correlation between the proportion of Ugandans and labor force participation rate among population ages 16 and over in the United States with a correlation coefficient (R) of 0.133 and weighted average of 67.4%, a difference of 6.1%.
In Labor Force | Age > 16 Correlation Summary
| Measurement | Cree | Ugandan |
| Minimum | 26.3% | 42.9% |
| Maximum | 73.9% | 91.4% |
| Range | 47.6% | 48.5% |
| Mean | 55.4% | 66.9% |
| Median | 58.2% | 66.5% |
| Interquartile 25% (IQ1) | 52.0% | 64.5% |
| Interquartile 75% (IQ3) | 61.7% | 69.6% |
| Interquartile Range (IQR) | 9.7% | 5.1% |
| Standard Deviation (Sample) | 10.2% | 7.5% |
| Standard Deviation (Population) | 10.1% | 7.4% |
Similar Demographics by In Labor Force | Age > 16
Demographics Similar to Cree by In Labor Force | Age > 16
In terms of in labor force | age > 16, the demographic groups most similar to Cree are Delaware (63.6%, a difference of 0.040%), Spanish American (63.6%, a difference of 0.050%), Nonimmigrants (63.5%, a difference of 0.050%), Immigrants from the Azores (63.6%, a difference of 0.080%), and White/Caucasian (63.6%, a difference of 0.090%).
| Demographics | Rating | Rank | In Labor Force | Age > 16 |
| Immigrants | North America | 0.0 /100 | #296 | Tragic 63.7% |
| Immigrants | Grenada | 0.0 /100 | #297 | Tragic 63.6% |
| Comanche | 0.0 /100 | #298 | Tragic 63.6% |
| Whites/Caucasians | 0.0 /100 | #299 | Tragic 63.6% |
| Immigrants | Azores | 0.0 /100 | #300 | Tragic 63.6% |
| Spanish Americans | 0.0 /100 | #301 | Tragic 63.6% |
| Delaware | 0.0 /100 | #302 | Tragic 63.6% |
| Cree | 0.0 /100 | #303 | Tragic 63.5% |
| Immigrants | Nonimmigrants | 0.0 /100 | #304 | Tragic 63.5% |
| Osage | 0.0 /100 | #305 | Tragic 63.5% |
| Blacks/African Americans | 0.0 /100 | #306 | Tragic 63.4% |
| Central American Indians | 0.0 /100 | #307 | Tragic 63.4% |
| Pennsylvania Germans | 0.0 /100 | #308 | Tragic 63.4% |
| Scotch-Irish | 0.0 /100 | #309 | Tragic 63.3% |
| Shoshone | 0.0 /100 | #310 | Tragic 63.2% |
Demographics Similar to Ugandans by In Labor Force | Age > 16
In terms of in labor force | age > 16, the demographic groups most similar to Ugandans are Immigrants from Africa (67.4%, a difference of 0.030%), Immigrants from Cabo Verde (67.3%, a difference of 0.050%), Cambodian (67.4%, a difference of 0.060%), Zimbabwean (67.3%, a difference of 0.13%), and Immigrants from Uganda (67.5%, a difference of 0.18%).
| Demographics | Rating | Rank | In Labor Force | Age > 16 |
| Immigrants | India | 100.0 /100 | #17 | Exceptional 67.6% |
| Immigrants | Liberia | 100.0 /100 | #18 | Exceptional 67.6% |
| Kenyans | 100.0 /100 | #19 | Exceptional 67.6% |
| Immigrants | Kenya | 100.0 /100 | #20 | Exceptional 67.6% |
| Tongans | 100.0 /100 | #21 | Exceptional 67.5% |
| Immigrants | Uganda | 100.0 /100 | #22 | Exceptional 67.5% |
| Cambodians | 100.0 /100 | #23 | Exceptional 67.4% |
| Ugandans | 100.0 /100 | #24 | Exceptional 67.4% |
| Immigrants | Africa | 100.0 /100 | #25 | Exceptional 67.4% |
| Immigrants | Cabo Verde | 100.0 /100 | #26 | Exceptional 67.3% |
| Zimbabweans | 100.0 /100 | #27 | Exceptional 67.3% |
| Immigrants | Morocco | 100.0 /100 | #28 | Exceptional 67.2% |
| Thais | 100.0 /100 | #29 | Exceptional 67.2% |
| Immigrants | Zaire | 100.0 /100 | #30 | Exceptional 67.2% |
| Ghanaians | 100.0 /100 | #31 | Exceptional 67.1% |