Cree vs English College, 1 year or more
COMPARE
Cree
English
College, 1 year or more
College, 1 year or more Comparison
Cree
English
56.8%
COLLEGE, 1 YEAR OR MORE
3.6/ 100
METRIC RATING
229th/ 347
METRIC RANK
60.0%
COLLEGE, 1 YEAR OR MORE
67.2/ 100
METRIC RATING
158th/ 347
METRIC RANK
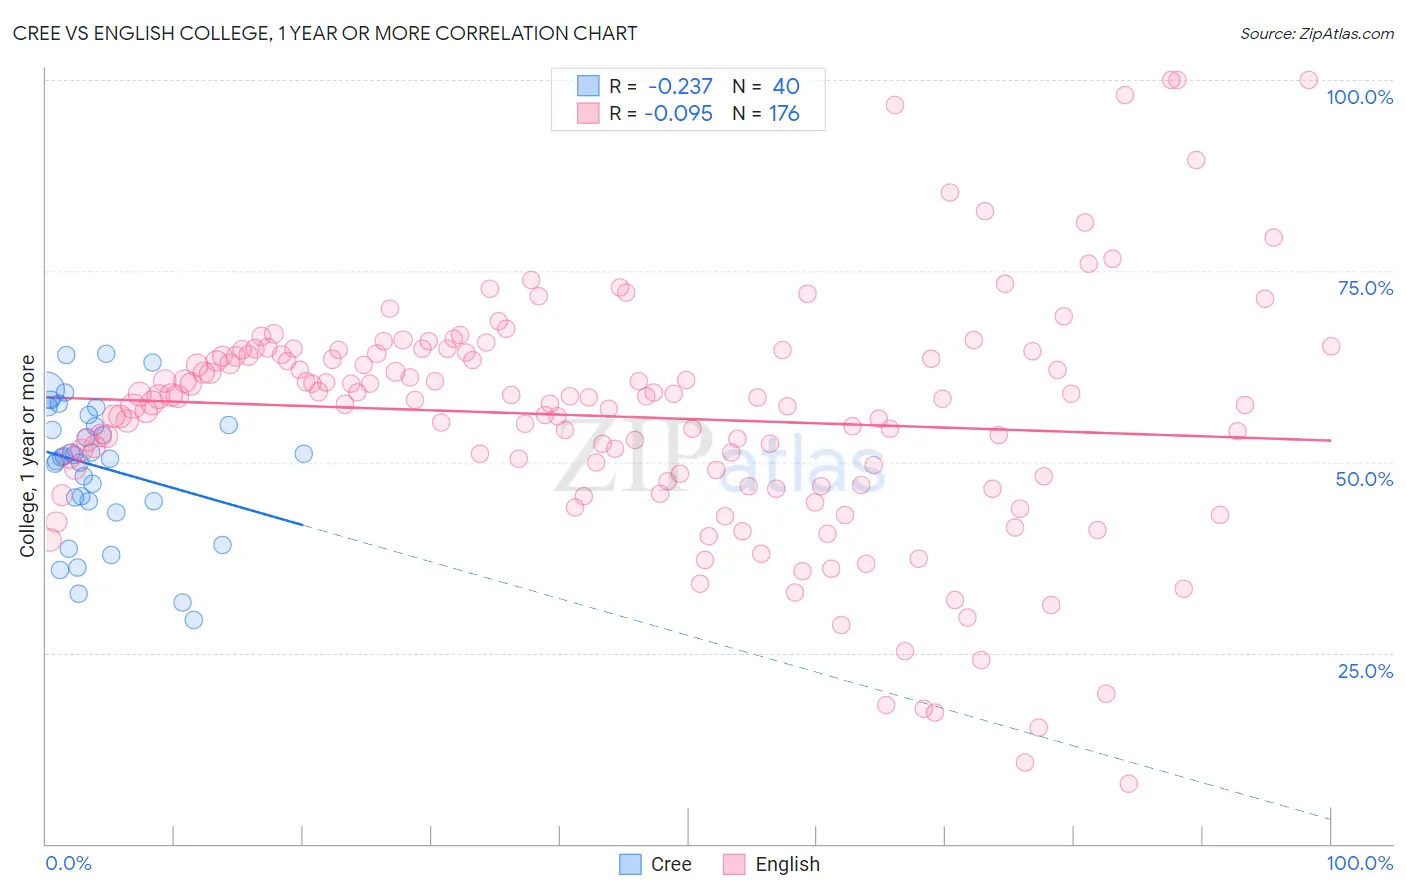
Cree vs English College, 1 year or more Correlation Chart
The statistical analysis conducted on geographies consisting of 76,211,685 people shows a weak negative correlation between the proportion of Cree and percentage of population with at least college, 1 year or more education in the United States with a correlation coefficient (R) of -0.237 and weighted average of 56.8%. Similarly, the statistical analysis conducted on geographies consisting of 579,957,546 people shows a slight negative correlation between the proportion of English and percentage of population with at least college, 1 year or more education in the United States with a correlation coefficient (R) of -0.095 and weighted average of 60.0%, a difference of 5.6%.
College, 1 year or more Correlation Summary
| Measurement | Cree | English |
| Minimum | 29.2% | 7.9% |
| Maximum | 64.2% | 100.0% |
| Range | 35.0% | 92.1% |
| Mean | 49.3% | 55.9% |
| Median | 50.6% | 58.3% |
| Interquartile 25% (IQ1) | 44.8% | 47.8% |
| Interquartile 75% (IQ3) | 55.5% | 64.2% |
| Interquartile Range (IQR) | 10.7% | 16.4% |
| Standard Deviation (Sample) | 8.9% | 15.8% |
| Standard Deviation (Population) | 8.8% | 15.8% |
Similar Demographics by College, 1 year or more
Demographics Similar to Cree by College, 1 year or more
In terms of college, 1 year or more, the demographic groups most similar to Cree are Immigrants from Fiji (56.9%, a difference of 0.13%), Liberian (56.7%, a difference of 0.22%), Immigrants (57.0%, a difference of 0.28%), Immigrants from Western Africa (57.0%, a difference of 0.35%), and Vietnamese (57.0%, a difference of 0.37%).
| Demographics | Rating | Rank | College, 1 year or more |
| Sub-Saharan Africans | 6.1 /100 | #222 | Tragic 57.3% |
| Portuguese | 5.4 /100 | #223 | Tragic 57.2% |
| Hmong | 5.4 /100 | #224 | Tragic 57.2% |
| Vietnamese | 4.7 /100 | #225 | Tragic 57.0% |
| Immigrants | Western Africa | 4.6 /100 | #226 | Tragic 57.0% |
| Immigrants | Immigrants | 4.4 /100 | #227 | Tragic 57.0% |
| Immigrants | Fiji | 4.0 /100 | #228 | Tragic 56.9% |
| Cree | 3.6 /100 | #229 | Tragic 56.8% |
| Liberians | 3.1 /100 | #230 | Tragic 56.7% |
| Immigrants | Burma/Myanmar | 2.7 /100 | #231 | Tragic 56.6% |
| Immigrants | Bangladesh | 2.6 /100 | #232 | Tragic 56.6% |
| Immigrants | Nonimmigrants | 2.5 /100 | #233 | Tragic 56.5% |
| Spanish Americans | 1.8 /100 | #234 | Tragic 56.3% |
| West Indians | 1.8 /100 | #235 | Tragic 56.3% |
| Iroquois | 1.7 /100 | #236 | Tragic 56.2% |
Demographics Similar to English by College, 1 year or more
In terms of college, 1 year or more, the demographic groups most similar to English are Immigrants from Iraq (60.0%, a difference of 0.010%), South American Indian (60.0%, a difference of 0.020%), Immigrants from Armenia (60.0%, a difference of 0.10%), Somali (59.9%, a difference of 0.15%), and Sudanese (60.2%, a difference of 0.36%).
| Demographics | Rating | Rank | College, 1 year or more |
| Albanians | 77.8 /100 | #151 | Good 60.4% |
| Immigrants | Germany | 76.1 /100 | #152 | Good 60.3% |
| Sierra Leoneans | 74.1 /100 | #153 | Good 60.2% |
| Sudanese | 73.0 /100 | #154 | Good 60.2% |
| Moroccans | 72.9 /100 | #155 | Good 60.2% |
| Finns | 72.9 /100 | #156 | Good 60.2% |
| Immigrants | Armenia | 68.8 /100 | #157 | Good 60.0% |
| English | 67.2 /100 | #158 | Good 60.0% |
| Immigrants | Iraq | 67.0 /100 | #159 | Good 60.0% |
| South American Indians | 66.9 /100 | #160 | Good 60.0% |
| Somalis | 64.5 /100 | #161 | Good 59.9% |
| Koreans | 58.5 /100 | #162 | Average 59.7% |
| Immigrants | Somalia | 58.3 /100 | #163 | Average 59.7% |
| Belgians | 58.1 /100 | #164 | Average 59.7% |
| Irish | 56.1 /100 | #165 | Average 59.6% |