Cree vs Immigrants from Philippines College, 1 year or more
COMPARE
Cree
Immigrants from Philippines
College, 1 year or more
College, 1 year or more Comparison
Cree
Immigrants from Philippines
56.8%
COLLEGE, 1 YEAR OR MORE
3.6/ 100
METRIC RATING
229th/ 347
METRIC RANK
58.7%
COLLEGE, 1 YEAR OR MORE
29.2/ 100
METRIC RATING
191st/ 347
METRIC RANK
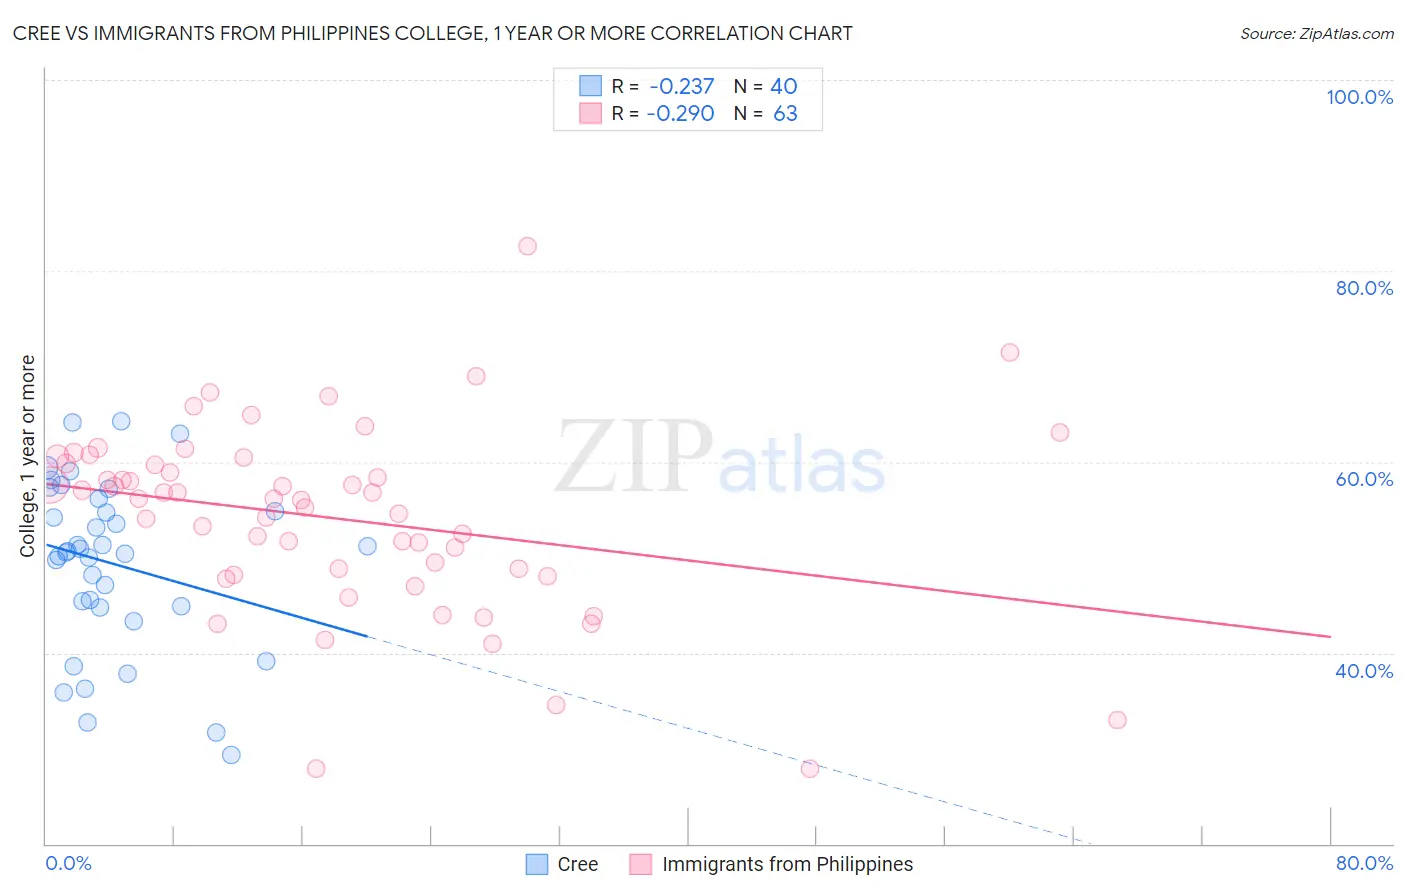
Cree vs Immigrants from Philippines College, 1 year or more Correlation Chart
The statistical analysis conducted on geographies consisting of 76,211,685 people shows a weak negative correlation between the proportion of Cree and percentage of population with at least college, 1 year or more education in the United States with a correlation coefficient (R) of -0.237 and weighted average of 56.8%. Similarly, the statistical analysis conducted on geographies consisting of 471,303,821 people shows a weak negative correlation between the proportion of Immigrants from Philippines and percentage of population with at least college, 1 year or more education in the United States with a correlation coefficient (R) of -0.290 and weighted average of 58.7%, a difference of 3.3%.
College, 1 year or more Correlation Summary
| Measurement | Cree | Immigrants from Philippines |
| Minimum | 29.2% | 27.9% |
| Maximum | 64.2% | 82.6% |
| Range | 35.0% | 54.7% |
| Mean | 49.3% | 54.1% |
| Median | 50.6% | 56.1% |
| Interquartile 25% (IQ1) | 44.8% | 48.1% |
| Interquartile 75% (IQ3) | 55.5% | 59.9% |
| Interquartile Range (IQR) | 10.7% | 11.7% |
| Standard Deviation (Sample) | 8.9% | 9.9% |
| Standard Deviation (Population) | 8.8% | 9.8% |
Similar Demographics by College, 1 year or more
Demographics Similar to Cree by College, 1 year or more
In terms of college, 1 year or more, the demographic groups most similar to Cree are Immigrants from Fiji (56.9%, a difference of 0.13%), Liberian (56.7%, a difference of 0.22%), Immigrants (57.0%, a difference of 0.28%), Immigrants from Western Africa (57.0%, a difference of 0.35%), and Vietnamese (57.0%, a difference of 0.37%).
| Demographics | Rating | Rank | College, 1 year or more |
| Sub-Saharan Africans | 6.1 /100 | #222 | Tragic 57.3% |
| Portuguese | 5.4 /100 | #223 | Tragic 57.2% |
| Hmong | 5.4 /100 | #224 | Tragic 57.2% |
| Vietnamese | 4.7 /100 | #225 | Tragic 57.0% |
| Immigrants | Western Africa | 4.6 /100 | #226 | Tragic 57.0% |
| Immigrants | Immigrants | 4.4 /100 | #227 | Tragic 57.0% |
| Immigrants | Fiji | 4.0 /100 | #228 | Tragic 56.9% |
| Cree | 3.6 /100 | #229 | Tragic 56.8% |
| Liberians | 3.1 /100 | #230 | Tragic 56.7% |
| Immigrants | Burma/Myanmar | 2.7 /100 | #231 | Tragic 56.6% |
| Immigrants | Bangladesh | 2.6 /100 | #232 | Tragic 56.6% |
| Immigrants | Nonimmigrants | 2.5 /100 | #233 | Tragic 56.5% |
| Spanish Americans | 1.8 /100 | #234 | Tragic 56.3% |
| West Indians | 1.8 /100 | #235 | Tragic 56.3% |
| Iroquois | 1.7 /100 | #236 | Tragic 56.2% |
Demographics Similar to Immigrants from Philippines by College, 1 year or more
In terms of college, 1 year or more, the demographic groups most similar to Immigrants from Philippines are Colombian (58.7%, a difference of 0.10%), Peruvian (58.6%, a difference of 0.11%), Immigrants from Cameroon (58.8%, a difference of 0.13%), Uruguayan (58.8%, a difference of 0.17%), and Costa Rican (58.6%, a difference of 0.18%).
| Demographics | Rating | Rank | College, 1 year or more |
| Spaniards | 38.3 /100 | #184 | Fair 59.0% |
| South Americans | 35.9 /100 | #185 | Fair 59.0% |
| Scotch-Irish | 34.7 /100 | #186 | Fair 58.9% |
| Germans | 34.7 /100 | #187 | Fair 58.9% |
| French | 34.4 /100 | #188 | Fair 58.9% |
| Uruguayans | 31.8 /100 | #189 | Fair 58.8% |
| Immigrants | Cameroon | 31.2 /100 | #190 | Fair 58.8% |
| Immigrants | Philippines | 29.2 /100 | #191 | Fair 58.7% |
| Colombians | 27.6 /100 | #192 | Fair 58.7% |
| Peruvians | 27.5 /100 | #193 | Fair 58.6% |
| Costa Ricans | 26.4 /100 | #194 | Fair 58.6% |
| Dutch | 26.2 /100 | #195 | Fair 58.6% |
| Guamanians/Chamorros | 26.2 /100 | #196 | Fair 58.6% |
| Immigrants | Thailand | 26.0 /100 | #197 | Fair 58.6% |
| Immigrants | South Eastern Asia | 25.1 /100 | #198 | Fair 58.5% |