Iranian vs Immigrants from Ethiopia Doctorate Degree
COMPARE
Iranian
Immigrants from Ethiopia
Doctorate Degree
Doctorate Degree Comparison
Iranians
Immigrants from Ethiopia
3.1%
DOCTORATE DEGREE
100.0/ 100
METRIC RATING
5th/ 347
METRIC RANK
2.4%
DOCTORATE DEGREE
100.0/ 100
METRIC RATING
57th/ 347
METRIC RANK
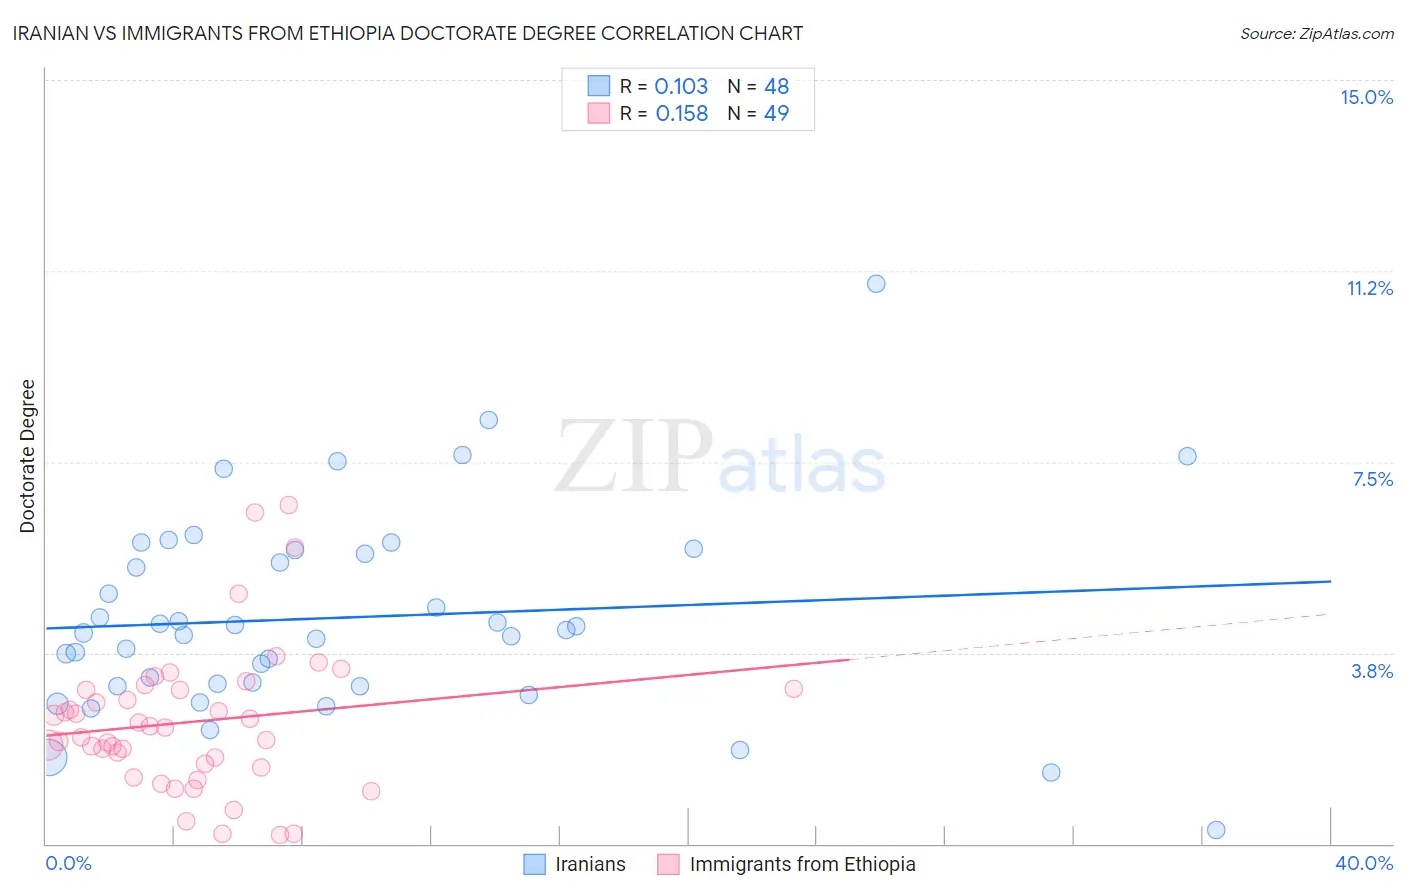
Iranian vs Immigrants from Ethiopia Doctorate Degree Correlation Chart
The statistical analysis conducted on geographies consisting of 315,770,820 people shows a poor positive correlation between the proportion of Iranians and percentage of population with at least doctorate degree education in the United States with a correlation coefficient (R) of 0.103 and weighted average of 3.1%. Similarly, the statistical analysis conducted on geographies consisting of 210,993,221 people shows a poor positive correlation between the proportion of Immigrants from Ethiopia and percentage of population with at least doctorate degree education in the United States with a correlation coefficient (R) of 0.158 and weighted average of 2.4%, a difference of 33.8%.
Doctorate Degree Correlation Summary
| Measurement | Iranian | Immigrants from Ethiopia |
| Minimum | 0.26% | 0.18% |
| Maximum | 11.0% | 6.7% |
| Range | 10.7% | 6.5% |
| Mean | 4.4% | 2.4% |
| Median | 4.2% | 2.3% |
| Interquartile 25% (IQ1) | 3.1% | 1.5% |
| Interquartile 75% (IQ3) | 5.7% | 3.0% |
| Interquartile Range (IQR) | 2.6% | 1.5% |
| Standard Deviation (Sample) | 2.0% | 1.4% |
| Standard Deviation (Population) | 2.0% | 1.4% |
Similar Demographics by Doctorate Degree
Demographics Similar to Iranians by Doctorate Degree
In terms of doctorate degree, the demographic groups most similar to Iranians are Immigrants from Taiwan (3.2%, a difference of 1.5%), Immigrants from Switzerland (3.1%, a difference of 1.9%), Immigrants from China (3.1%, a difference of 2.0%), Immigrants from Israel (3.0%, a difference of 3.3%), and Immigrants from Iran (3.0%, a difference of 4.0%).
| Demographics | Rating | Rank | Doctorate Degree |
| Immigrants | Singapore | 100.0 /100 | #1 | Exceptional 3.7% |
| Filipinos | 100.0 /100 | #2 | Exceptional 3.4% |
| Okinawans | 100.0 /100 | #3 | Exceptional 3.3% |
| Immigrants | Taiwan | 100.0 /100 | #4 | Exceptional 3.2% |
| Iranians | 100.0 /100 | #5 | Exceptional 3.1% |
| Immigrants | Switzerland | 100.0 /100 | #6 | Exceptional 3.1% |
| Immigrants | China | 100.0 /100 | #7 | Exceptional 3.1% |
| Immigrants | Israel | 100.0 /100 | #8 | Exceptional 3.0% |
| Immigrants | Iran | 100.0 /100 | #9 | Exceptional 3.0% |
| Immigrants | Eastern Asia | 100.0 /100 | #10 | Exceptional 3.0% |
| Indians (Asian) | 100.0 /100 | #11 | Exceptional 2.9% |
| Immigrants | Belgium | 100.0 /100 | #12 | Exceptional 2.9% |
| Immigrants | Sweden | 100.0 /100 | #13 | Exceptional 2.9% |
| Immigrants | France | 100.0 /100 | #14 | Exceptional 2.9% |
| Immigrants | India | 100.0 /100 | #15 | Exceptional 2.8% |
Demographics Similar to Immigrants from Ethiopia by Doctorate Degree
In terms of doctorate degree, the demographic groups most similar to Immigrants from Ethiopia are Ethiopian (2.3%, a difference of 0.12%), Immigrants from Czechoslovakia (2.4%, a difference of 0.44%), Bolivian (2.4%, a difference of 0.53%), South African (2.3%, a difference of 0.56%), and Immigrants from Serbia (2.3%, a difference of 0.58%).
| Demographics | Rating | Rank | Doctorate Degree |
| Immigrants | Norway | 100.0 /100 | #50 | Exceptional 2.4% |
| Australians | 100.0 /100 | #51 | Exceptional 2.4% |
| Bulgarians | 100.0 /100 | #52 | Exceptional 2.4% |
| Immigrants | Latvia | 100.0 /100 | #53 | Exceptional 2.4% |
| Immigrants | Indonesia | 100.0 /100 | #54 | Exceptional 2.4% |
| Bolivians | 100.0 /100 | #55 | Exceptional 2.4% |
| Immigrants | Czechoslovakia | 100.0 /100 | #56 | Exceptional 2.4% |
| Immigrants | Ethiopia | 100.0 /100 | #57 | Exceptional 2.4% |
| Ethiopians | 99.9 /100 | #58 | Exceptional 2.3% |
| South Africans | 99.9 /100 | #59 | Exceptional 2.3% |
| Immigrants | Serbia | 99.9 /100 | #60 | Exceptional 2.3% |
| Bhutanese | 99.9 /100 | #61 | Exceptional 2.3% |
| Immigrants | Europe | 99.9 /100 | #62 | Exceptional 2.3% |
| Laotians | 99.9 /100 | #63 | Exceptional 2.3% |
| Immigrants | Greece | 99.9 /100 | #64 | Exceptional 2.3% |