Salvadoran vs Immigrants from Ethiopia Doctorate Degree
COMPARE
Salvadoran
Immigrants from Ethiopia
Doctorate Degree
Doctorate Degree Comparison
Salvadorans
Immigrants from Ethiopia
1.5%
DOCTORATE DEGREE
0.5/ 100
METRIC RATING
270th/ 347
METRIC RANK
2.4%
DOCTORATE DEGREE
100.0/ 100
METRIC RATING
57th/ 347
METRIC RANK
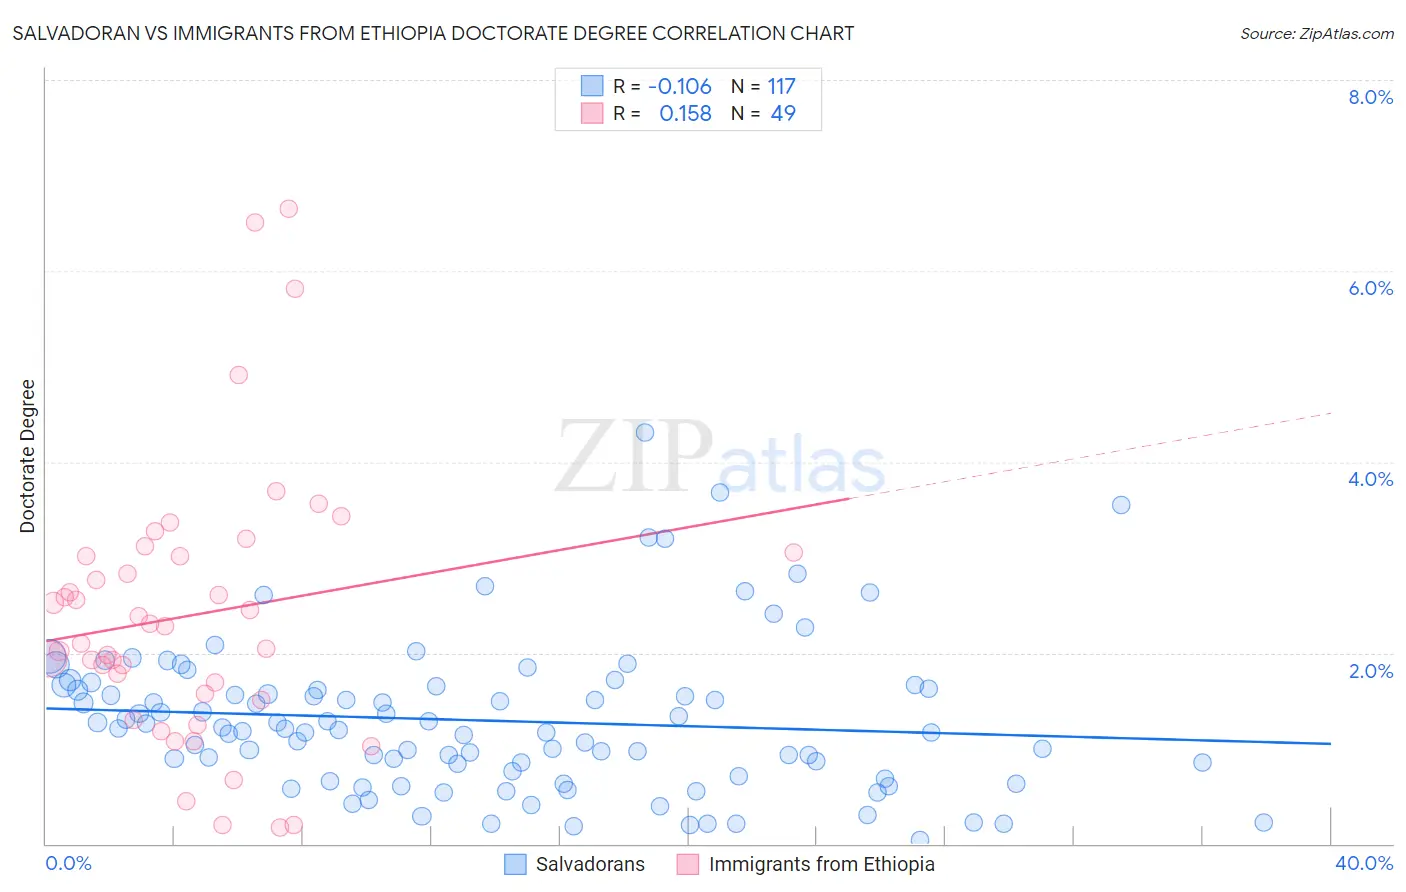
Salvadoran vs Immigrants from Ethiopia Doctorate Degree Correlation Chart
The statistical analysis conducted on geographies consisting of 393,514,782 people shows a poor negative correlation between the proportion of Salvadorans and percentage of population with at least doctorate degree education in the United States with a correlation coefficient (R) of -0.106 and weighted average of 1.5%. Similarly, the statistical analysis conducted on geographies consisting of 210,993,221 people shows a poor positive correlation between the proportion of Immigrants from Ethiopia and percentage of population with at least doctorate degree education in the United States with a correlation coefficient (R) of 0.158 and weighted average of 2.4%, a difference of 59.3%.
Doctorate Degree Correlation Summary
| Measurement | Salvadoran | Immigrants from Ethiopia |
| Minimum | 0.038% | 0.18% |
| Maximum | 4.3% | 6.7% |
| Range | 4.3% | 6.5% |
| Mean | 1.3% | 2.4% |
| Median | 1.2% | 2.3% |
| Interquartile 25% (IQ1) | 0.74% | 1.5% |
| Interquartile 75% (IQ3) | 1.6% | 3.0% |
| Interquartile Range (IQR) | 0.90% | 1.5% |
| Standard Deviation (Sample) | 0.78% | 1.4% |
| Standard Deviation (Population) | 0.78% | 1.4% |
Similar Demographics by Doctorate Degree
Demographics Similar to Salvadorans by Doctorate Degree
In terms of doctorate degree, the demographic groups most similar to Salvadorans are Crow (1.5%, a difference of 0.030%), Immigrants from Trinidad and Tobago (1.5%, a difference of 0.070%), U.S. Virgin Islander (1.5%, a difference of 0.11%), Kiowa (1.5%, a difference of 0.12%), and Immigrants from Barbados (1.5%, a difference of 0.16%).
| Demographics | Rating | Rank | Doctorate Degree |
| Immigrants | Bahamas | 0.7 /100 | #263 | Tragic 1.5% |
| Blackfeet | 0.7 /100 | #264 | Tragic 1.5% |
| Nicaraguans | 0.6 /100 | #265 | Tragic 1.5% |
| Immigrants | Liberia | 0.5 /100 | #266 | Tragic 1.5% |
| Kiowa | 0.5 /100 | #267 | Tragic 1.5% |
| U.S. Virgin Islanders | 0.5 /100 | #268 | Tragic 1.5% |
| Crow | 0.5 /100 | #269 | Tragic 1.5% |
| Salvadorans | 0.5 /100 | #270 | Tragic 1.5% |
| Immigrants | Trinidad and Tobago | 0.5 /100 | #271 | Tragic 1.5% |
| Immigrants | Barbados | 0.4 /100 | #272 | Tragic 1.5% |
| Sioux | 0.4 /100 | #273 | Tragic 1.5% |
| Yaqui | 0.4 /100 | #274 | Tragic 1.5% |
| Aleuts | 0.4 /100 | #275 | Tragic 1.5% |
| Paiute | 0.4 /100 | #276 | Tragic 1.5% |
| Bahamians | 0.4 /100 | #277 | Tragic 1.5% |
Demographics Similar to Immigrants from Ethiopia by Doctorate Degree
In terms of doctorate degree, the demographic groups most similar to Immigrants from Ethiopia are Ethiopian (2.3%, a difference of 0.12%), Immigrants from Czechoslovakia (2.4%, a difference of 0.44%), Bolivian (2.4%, a difference of 0.53%), South African (2.3%, a difference of 0.56%), and Immigrants from Serbia (2.3%, a difference of 0.58%).
| Demographics | Rating | Rank | Doctorate Degree |
| Immigrants | Norway | 100.0 /100 | #50 | Exceptional 2.4% |
| Australians | 100.0 /100 | #51 | Exceptional 2.4% |
| Bulgarians | 100.0 /100 | #52 | Exceptional 2.4% |
| Immigrants | Latvia | 100.0 /100 | #53 | Exceptional 2.4% |
| Immigrants | Indonesia | 100.0 /100 | #54 | Exceptional 2.4% |
| Bolivians | 100.0 /100 | #55 | Exceptional 2.4% |
| Immigrants | Czechoslovakia | 100.0 /100 | #56 | Exceptional 2.4% |
| Immigrants | Ethiopia | 100.0 /100 | #57 | Exceptional 2.4% |
| Ethiopians | 99.9 /100 | #58 | Exceptional 2.3% |
| South Africans | 99.9 /100 | #59 | Exceptional 2.3% |
| Immigrants | Serbia | 99.9 /100 | #60 | Exceptional 2.3% |
| Bhutanese | 99.9 /100 | #61 | Exceptional 2.3% |
| Immigrants | Europe | 99.9 /100 | #62 | Exceptional 2.3% |
| Laotians | 99.9 /100 | #63 | Exceptional 2.3% |
| Immigrants | Greece | 99.9 /100 | #64 | Exceptional 2.3% |