Slavic vs Immigrants from Egypt Professional Degree
COMPARE
Slavic
Immigrants from Egypt
Professional Degree
Professional Degree Comparison
Slavs
Immigrants from Egypt
4.5%
PROFESSIONAL DEGREE
70.8/ 100
METRIC RATING
155th/ 347
METRIC RANK
5.1%
PROFESSIONAL DEGREE
98.5/ 100
METRIC RATING
101st/ 347
METRIC RANK
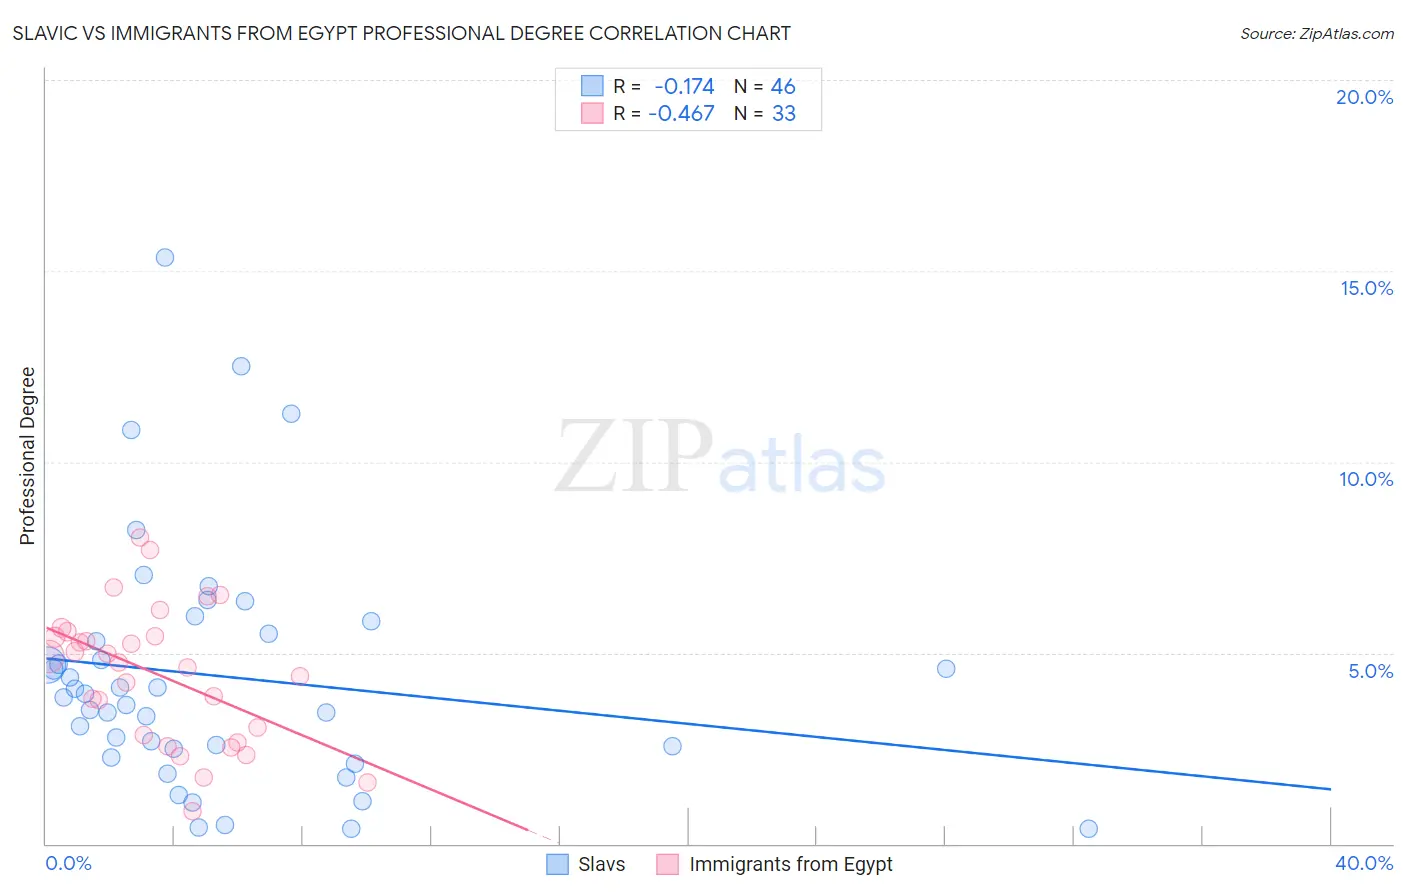
Slavic vs Immigrants from Egypt Professional Degree Correlation Chart
The statistical analysis conducted on geographies consisting of 270,501,268 people shows a poor negative correlation between the proportion of Slavs and percentage of population with at least professional degree education in the United States with a correlation coefficient (R) of -0.174 and weighted average of 4.5%. Similarly, the statistical analysis conducted on geographies consisting of 245,381,145 people shows a moderate negative correlation between the proportion of Immigrants from Egypt and percentage of population with at least professional degree education in the United States with a correlation coefficient (R) of -0.467 and weighted average of 5.1%, a difference of 11.6%.
Professional Degree Correlation Summary
| Measurement | Slavic | Immigrants from Egypt |
| Minimum | 0.39% | 0.86% |
| Maximum | 15.4% | 8.0% |
| Range | 15.0% | 7.2% |
| Mean | 4.4% | 4.4% |
| Median | 3.9% | 4.7% |
| Interquartile 25% (IQ1) | 2.5% | 2.7% |
| Interquartile 75% (IQ3) | 5.5% | 5.5% |
| Interquartile Range (IQR) | 3.0% | 2.7% |
| Standard Deviation (Sample) | 3.2% | 1.8% |
| Standard Deviation (Population) | 3.2% | 1.8% |
Similar Demographics by Professional Degree
Demographics Similar to Slavs by Professional Degree
In terms of professional degree, the demographic groups most similar to Slavs are Swedish (4.5%, a difference of 0.15%), Iraqi (4.5%, a difference of 0.16%), Scottish (4.6%, a difference of 0.18%), Immigrants from Africa (4.6%, a difference of 0.30%), and Immigrants from Uruguay (4.6%, a difference of 0.30%).
| Demographics | Rating | Rank | Professional Degree |
| Slovenes | 76.1 /100 | #148 | Good 4.6% |
| Senegalese | 75.3 /100 | #149 | Good 4.6% |
| Immigrants | Oceania | 73.4 /100 | #150 | Good 4.6% |
| Poles | 72.6 /100 | #151 | Good 4.6% |
| Immigrants | Africa | 72.5 /100 | #152 | Good 4.6% |
| Immigrants | Uruguay | 72.5 /100 | #153 | Good 4.6% |
| Scottish | 71.8 /100 | #154 | Good 4.6% |
| Slavs | 70.8 /100 | #155 | Good 4.5% |
| Swedes | 69.9 /100 | #156 | Good 4.5% |
| Iraqis | 69.8 /100 | #157 | Good 4.5% |
| Immigrants | Armenia | 68.8 /100 | #158 | Good 4.5% |
| Vietnamese | 68.4 /100 | #159 | Good 4.5% |
| Immigrants | Senegal | 68.0 /100 | #160 | Good 4.5% |
| Assyrians/Chaldeans/Syriacs | 67.4 /100 | #161 | Good 4.5% |
| Peruvians | 65.2 /100 | #162 | Good 4.5% |
Demographics Similar to Immigrants from Egypt by Professional Degree
In terms of professional degree, the demographic groups most similar to Immigrants from Egypt are Ukrainian (5.1%, a difference of 0.080%), Immigrants from Northern Africa (5.1%, a difference of 0.33%), Arab (5.0%, a difference of 0.64%), Immigrants from Uganda (5.0%, a difference of 0.67%), and Immigrants from Ukraine (5.0%, a difference of 0.69%).
| Demographics | Rating | Rank | Professional Degree |
| Alsatians | 99.3 /100 | #94 | Exceptional 5.2% |
| Zimbabweans | 99.3 /100 | #95 | Exceptional 5.2% |
| Immigrants | Uzbekistan | 99.2 /100 | #96 | Exceptional 5.2% |
| Syrians | 99.1 /100 | #97 | Exceptional 5.2% |
| Austrians | 99.1 /100 | #98 | Exceptional 5.2% |
| Immigrants | Italy | 99.1 /100 | #99 | Exceptional 5.2% |
| Ugandans | 98.8 /100 | #100 | Exceptional 5.1% |
| Immigrants | Egypt | 98.5 /100 | #101 | Exceptional 5.1% |
| Ukrainians | 98.5 /100 | #102 | Exceptional 5.1% |
| Immigrants | Northern Africa | 98.4 /100 | #103 | Exceptional 5.1% |
| Arabs | 98.2 /100 | #104 | Exceptional 5.0% |
| Immigrants | Uganda | 98.2 /100 | #105 | Exceptional 5.0% |
| Immigrants | Ukraine | 98.2 /100 | #106 | Exceptional 5.0% |
| Maltese | 98.1 /100 | #107 | Exceptional 5.0% |
| Immigrants | Southern Europe | 98.1 /100 | #108 | Exceptional 5.0% |