Comanche vs Vietnamese 9th Grade
COMPARE
Comanche
Vietnamese
9th Grade
9th Grade Comparison
Comanche
Vietnamese
94.6%
9TH GRADE
14.9/ 100
METRIC RATING
209th/ 347
METRIC RANK
92.3%
9TH GRADE
0.0/ 100
METRIC RATING
313th/ 347
METRIC RANK
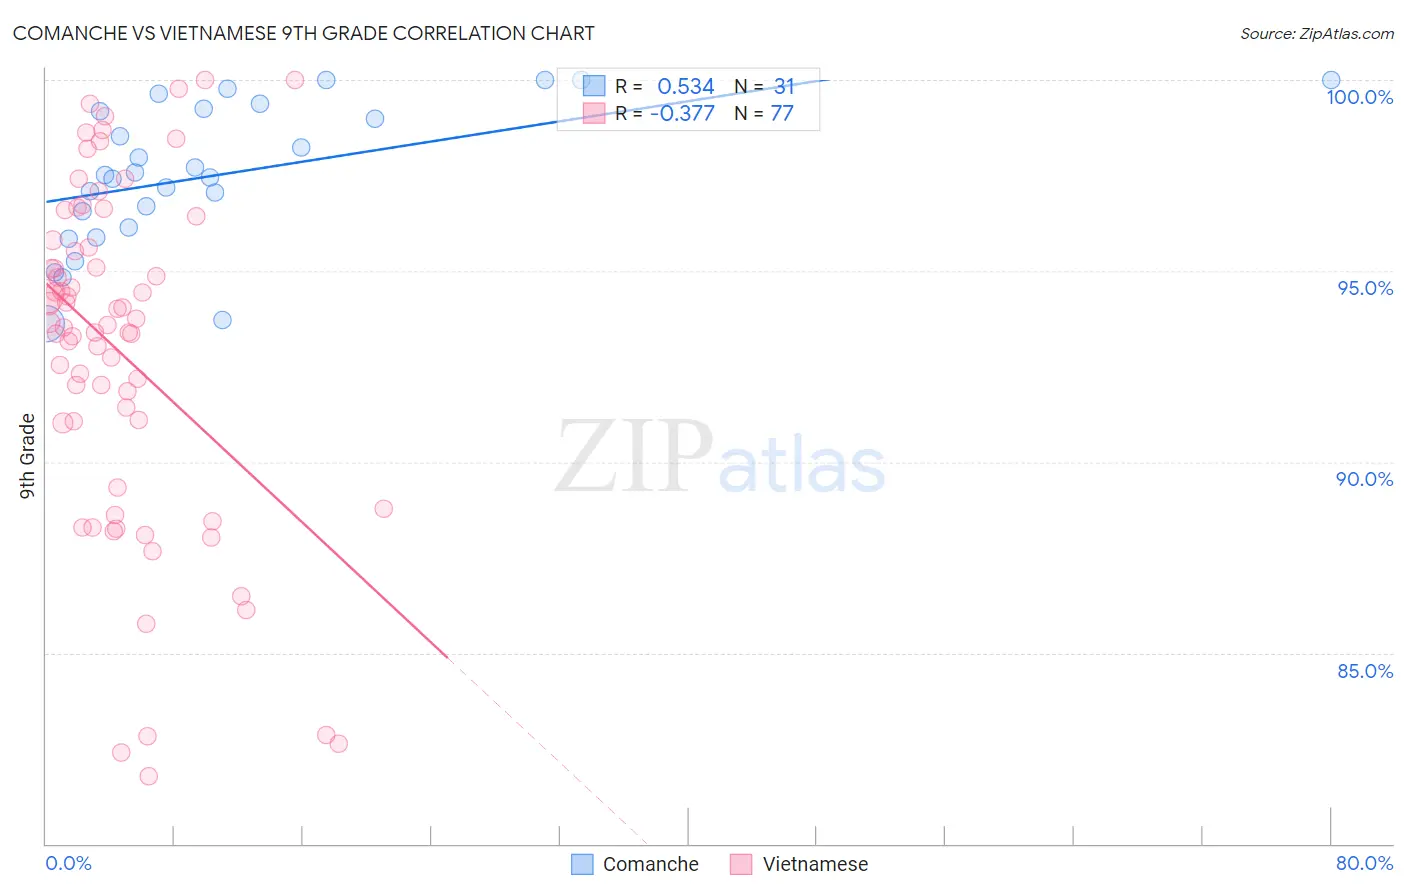
Comanche vs Vietnamese 9th Grade Correlation Chart
The statistical analysis conducted on geographies consisting of 109,786,530 people shows a substantial positive correlation between the proportion of Comanche and percentage of population with at least 9th grade education in the United States with a correlation coefficient (R) of 0.534 and weighted average of 94.6%. Similarly, the statistical analysis conducted on geographies consisting of 170,728,240 people shows a mild negative correlation between the proportion of Vietnamese and percentage of population with at least 9th grade education in the United States with a correlation coefficient (R) of -0.377 and weighted average of 92.3%, a difference of 2.5%.
9th Grade Correlation Summary
| Measurement | Comanche | Vietnamese |
| Minimum | 93.6% | 81.8% |
| Maximum | 100.0% | 100.0% |
| Range | 6.4% | 18.2% |
| Mean | 97.5% | 92.9% |
| Median | 97.5% | 93.6% |
| Interquartile 25% (IQ1) | 96.1% | 90.2% |
| Interquartile 75% (IQ3) | 99.2% | 95.7% |
| Interquartile Range (IQR) | 3.1% | 5.5% |
| Standard Deviation (Sample) | 1.9% | 4.4% |
| Standard Deviation (Population) | 1.8% | 4.4% |
Similar Demographics by 9th Grade
Demographics Similar to Comanche by 9th Grade
In terms of 9th grade, the demographic groups most similar to Comanche are Immigrants from Pakistan (94.6%, a difference of 0.010%), Immigrants from Morocco (94.6%, a difference of 0.020%), Immigrants from Chile (94.5%, a difference of 0.020%), Samoan (94.6%, a difference of 0.030%), and Immigrants from Sudan (94.6%, a difference of 0.040%).
| Demographics | Rating | Rank | 9th Grade |
| Immigrants | Eastern Asia | 19.8 /100 | #202 | Poor 94.6% |
| Immigrants | Bahamas | 19.8 /100 | #203 | Poor 94.6% |
| Moroccans | 19.6 /100 | #204 | Poor 94.6% |
| Immigrants | Sudan | 17.6 /100 | #205 | Poor 94.6% |
| Samoans | 17.3 /100 | #206 | Poor 94.6% |
| Immigrants | Morocco | 16.3 /100 | #207 | Poor 94.6% |
| Immigrants | Pakistan | 15.5 /100 | #208 | Poor 94.6% |
| Comanche | 14.9 /100 | #209 | Poor 94.6% |
| Immigrants | Chile | 13.4 /100 | #210 | Poor 94.5% |
| Immigrants | Indonesia | 12.3 /100 | #211 | Poor 94.5% |
| Immigrants | Malaysia | 12.2 /100 | #212 | Poor 94.5% |
| Immigrants | Oceania | 12.1 /100 | #213 | Poor 94.5% |
| Immigrants | Liberia | 11.8 /100 | #214 | Poor 94.5% |
| Immigrants | Syria | 11.0 /100 | #215 | Poor 94.5% |
| Immigrants | Western Asia | 10.7 /100 | #216 | Poor 94.5% |
Demographics Similar to Vietnamese by 9th Grade
In terms of 9th grade, the demographic groups most similar to Vietnamese are Houma (92.3%, a difference of 0.020%), Immigrants from Portugal (92.2%, a difference of 0.040%), Immigrants from Fiji (92.3%, a difference of 0.050%), Immigrants from Caribbean (92.2%, a difference of 0.050%), and Immigrants from Cambodia (92.4%, a difference of 0.080%).
| Demographics | Rating | Rank | 9th Grade |
| Immigrants | Vietnam | 0.0 /100 | #306 | Tragic 92.6% |
| Immigrants | Immigrants | 0.0 /100 | #307 | Tragic 92.5% |
| Immigrants | Guyana | 0.0 /100 | #308 | Tragic 92.5% |
| Immigrants | Bangladesh | 0.0 /100 | #309 | Tragic 92.4% |
| Immigrants | Cambodia | 0.0 /100 | #310 | Tragic 92.4% |
| Immigrants | Fiji | 0.0 /100 | #311 | Tragic 92.3% |
| Houma | 0.0 /100 | #312 | Tragic 92.3% |
| Vietnamese | 0.0 /100 | #313 | Tragic 92.3% |
| Immigrants | Portugal | 0.0 /100 | #314 | Tragic 92.2% |
| Immigrants | Caribbean | 0.0 /100 | #315 | Tragic 92.2% |
| Cape Verdeans | 0.0 /100 | #316 | Tragic 92.2% |
| Immigrants | Cuba | 0.0 /100 | #317 | Tragic 92.2% |
| Nepalese | 0.0 /100 | #318 | Tragic 92.0% |
| Ecuadorians | 0.0 /100 | #319 | Tragic 91.9% |
| Nicaraguans | 0.0 /100 | #320 | Tragic 91.9% |