Comanche vs Subsaharan African 9th Grade
COMPARE
Comanche
Subsaharan African
9th Grade
9th Grade Comparison
Comanche
Sub-Saharan Africans
94.6%
9TH GRADE
14.9/ 100
METRIC RATING
209th/ 347
METRIC RANK
94.4%
9TH GRADE
5.4/ 100
METRIC RATING
226th/ 347
METRIC RANK
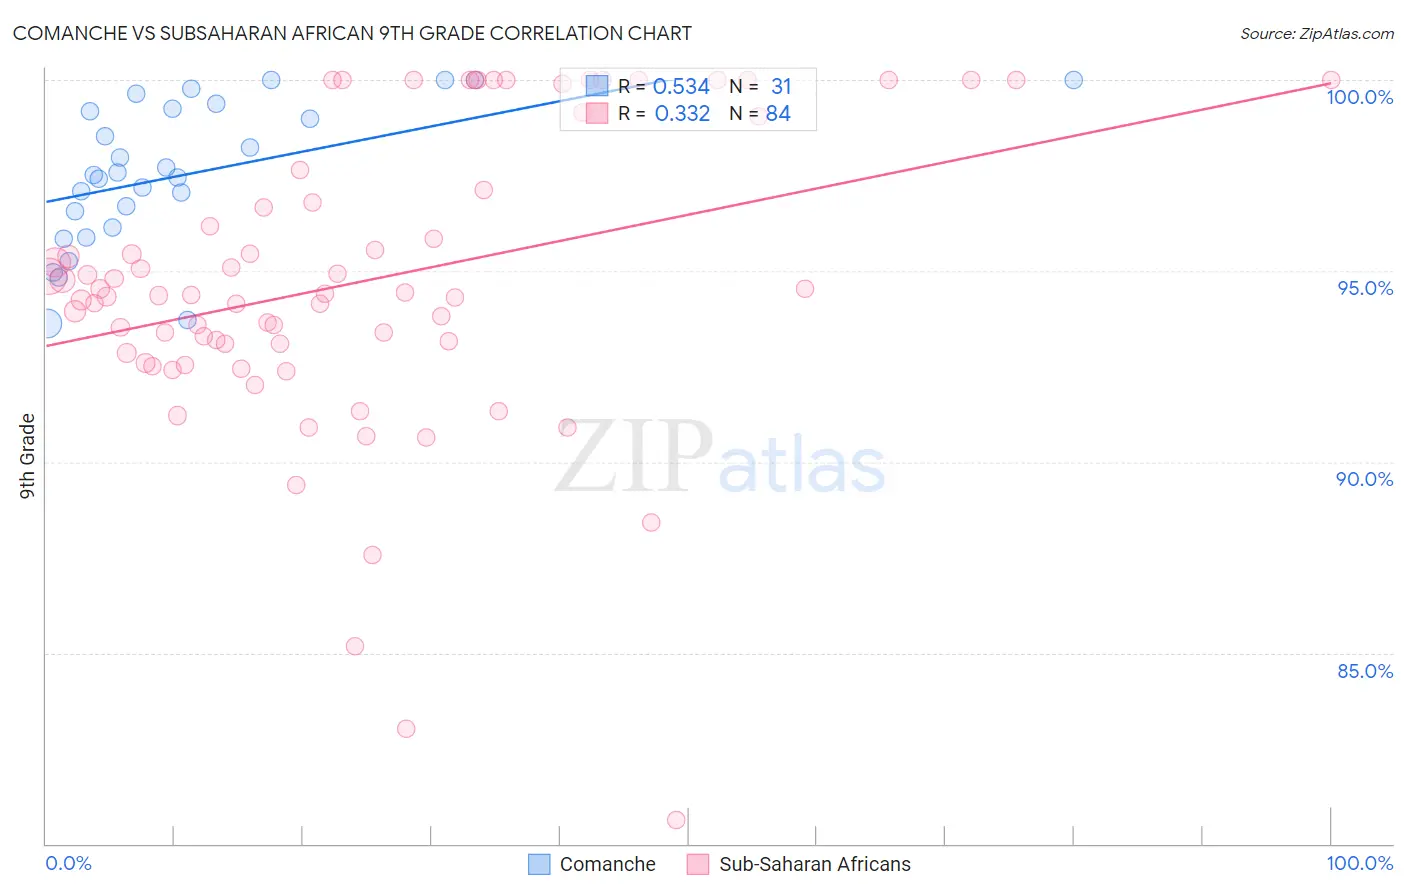
Comanche vs Subsaharan African 9th Grade Correlation Chart
The statistical analysis conducted on geographies consisting of 109,786,530 people shows a substantial positive correlation between the proportion of Comanche and percentage of population with at least 9th grade education in the United States with a correlation coefficient (R) of 0.534 and weighted average of 94.6%. Similarly, the statistical analysis conducted on geographies consisting of 508,219,008 people shows a mild positive correlation between the proportion of Sub-Saharan Africans and percentage of population with at least 9th grade education in the United States with a correlation coefficient (R) of 0.332 and weighted average of 94.4%, a difference of 0.21%.
9th Grade Correlation Summary
| Measurement | Comanche | Subsaharan African |
| Minimum | 93.6% | 80.6% |
| Maximum | 100.0% | 100.0% |
| Range | 6.4% | 19.4% |
| Mean | 97.5% | 94.7% |
| Median | 97.5% | 94.4% |
| Interquartile 25% (IQ1) | 96.1% | 93.0% |
| Interquartile 75% (IQ3) | 99.2% | 97.4% |
| Interquartile Range (IQR) | 3.1% | 4.4% |
| Standard Deviation (Sample) | 1.9% | 3.9% |
| Standard Deviation (Population) | 1.8% | 3.9% |
Demographics Similar to Comanche and Sub-Saharan Africans by 9th Grade
In terms of 9th grade, the demographic groups most similar to Comanche are Immigrants from Pakistan (94.6%, a difference of 0.010%), Immigrants from Morocco (94.6%, a difference of 0.020%), Immigrants from Chile (94.5%, a difference of 0.020%), Immigrants from Indonesia (94.5%, a difference of 0.040%), and Immigrants from Malaysia (94.5%, a difference of 0.040%). Similarly, the demographic groups most similar to Sub-Saharan Africans are Ethiopian (94.4%, a difference of 0.0%), Tongan (94.4%, a difference of 0.020%), Immigrants from Sierra Leone (94.4%, a difference of 0.020%), Bahamian (94.4%, a difference of 0.050%), and Immigrants from Asia (94.4%, a difference of 0.070%).
| Demographics | Rating | Rank | 9th Grade |
| Immigrants | Morocco | 16.3 /100 | #207 | Poor 94.6% |
| Immigrants | Pakistan | 15.5 /100 | #208 | Poor 94.6% |
| Comanche | 14.9 /100 | #209 | Poor 94.6% |
| Immigrants | Chile | 13.4 /100 | #210 | Poor 94.5% |
| Immigrants | Indonesia | 12.3 /100 | #211 | Poor 94.5% |
| Immigrants | Malaysia | 12.2 /100 | #212 | Poor 94.5% |
| Immigrants | Oceania | 12.1 /100 | #213 | Poor 94.5% |
| Immigrants | Liberia | 11.8 /100 | #214 | Poor 94.5% |
| Immigrants | Syria | 11.0 /100 | #215 | Poor 94.5% |
| Immigrants | Western Asia | 10.7 /100 | #216 | Poor 94.5% |
| Asians | 9.9 /100 | #217 | Tragic 94.5% |
| Portuguese | 9.2 /100 | #218 | Tragic 94.5% |
| Africans | 9.0 /100 | #219 | Tragic 94.5% |
| Indians (Asian) | 8.6 /100 | #220 | Tragic 94.5% |
| Immigrants | Eastern Africa | 8.2 /100 | #221 | Tragic 94.5% |
| Immigrants | Asia | 7.7 /100 | #222 | Tragic 94.4% |
| Bahamians | 7.0 /100 | #223 | Tragic 94.4% |
| Tongans | 6.0 /100 | #224 | Tragic 94.4% |
| Ethiopians | 5.4 /100 | #225 | Tragic 94.4% |
| Sub-Saharan Africans | 5.4 /100 | #226 | Tragic 94.4% |
| Immigrants | Sierra Leone | 4.8 /100 | #227 | Tragic 94.4% |