Immigrants from Jordan vs Vietnamese 9th Grade
COMPARE
Immigrants from Jordan
Vietnamese
9th Grade
9th Grade Comparison
Immigrants from Jordan
Vietnamese
95.1%
9TH GRADE
81.2/ 100
METRIC RATING
148th/ 347
METRIC RANK
92.3%
9TH GRADE
0.0/ 100
METRIC RATING
313th/ 347
METRIC RANK
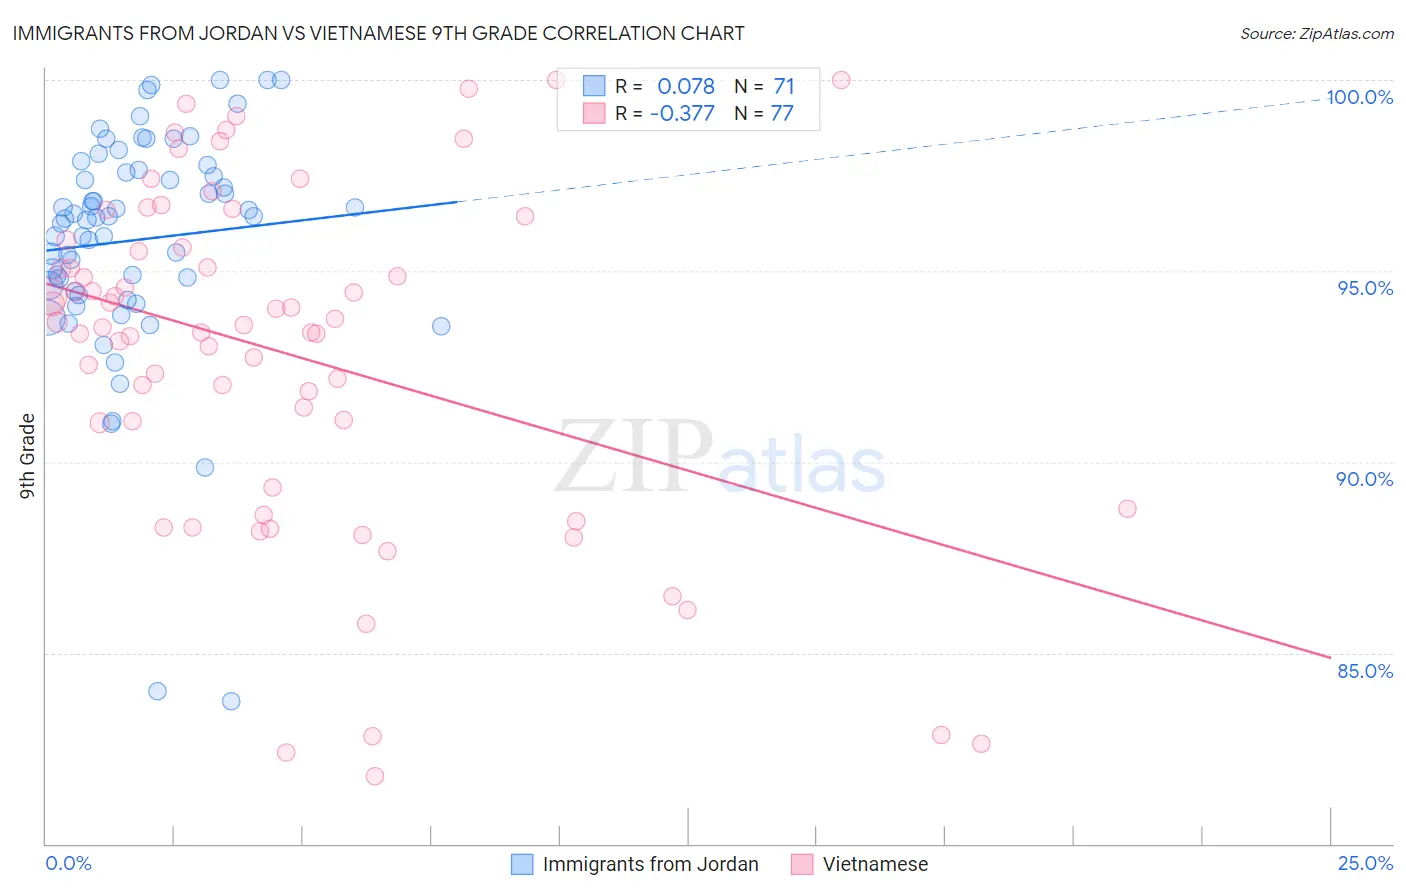
Immigrants from Jordan vs Vietnamese 9th Grade Correlation Chart
The statistical analysis conducted on geographies consisting of 181,278,272 people shows a slight positive correlation between the proportion of Immigrants from Jordan and percentage of population with at least 9th grade education in the United States with a correlation coefficient (R) of 0.078 and weighted average of 95.1%. Similarly, the statistical analysis conducted on geographies consisting of 170,728,240 people shows a mild negative correlation between the proportion of Vietnamese and percentage of population with at least 9th grade education in the United States with a correlation coefficient (R) of -0.377 and weighted average of 92.3%, a difference of 3.1%.
9th Grade Correlation Summary
| Measurement | Immigrants from Jordan | Vietnamese |
| Minimum | 83.7% | 81.8% |
| Maximum | 100.0% | 100.0% |
| Range | 16.3% | 18.2% |
| Mean | 95.8% | 92.9% |
| Median | 96.4% | 93.6% |
| Interquartile 25% (IQ1) | 94.5% | 90.2% |
| Interquartile 75% (IQ3) | 97.6% | 95.7% |
| Interquartile Range (IQR) | 3.2% | 5.5% |
| Standard Deviation (Sample) | 3.0% | 4.4% |
| Standard Deviation (Population) | 3.0% | 4.4% |
Similar Demographics by 9th Grade
Demographics Similar to Immigrants from Jordan by 9th Grade
In terms of 9th grade, the demographic groups most similar to Immigrants from Jordan are Pueblo (95.1%, a difference of 0.010%), Immigrants from Sri Lanka (95.1%, a difference of 0.010%), Choctaw (95.1%, a difference of 0.010%), Immigrants from Korea (95.1%, a difference of 0.020%), and Kenyan (95.1%, a difference of 0.020%).
| Demographics | Rating | Rank | 9th Grade |
| Immigrants | Bosnia and Herzegovina | 85.2 /100 | #141 | Excellent 95.2% |
| Immigrants | Greece | 84.6 /100 | #142 | Excellent 95.2% |
| Spanish | 84.4 /100 | #143 | Excellent 95.2% |
| Yup'ik | 83.3 /100 | #144 | Excellent 95.2% |
| Pueblo | 82.2 /100 | #145 | Excellent 95.1% |
| Immigrants | Sri Lanka | 82.1 /100 | #146 | Excellent 95.1% |
| Choctaw | 81.9 /100 | #147 | Excellent 95.1% |
| Immigrants | Jordan | 81.2 /100 | #148 | Excellent 95.1% |
| Immigrants | Korea | 79.6 /100 | #149 | Good 95.1% |
| Kenyans | 79.1 /100 | #150 | Good 95.1% |
| Cajuns | 77.3 /100 | #151 | Good 95.1% |
| Ugandans | 77.0 /100 | #152 | Good 95.1% |
| Albanians | 76.1 /100 | #153 | Good 95.1% |
| Arabs | 74.9 /100 | #154 | Good 95.1% |
| Immigrants | Kazakhstan | 74.7 /100 | #155 | Good 95.1% |
Demographics Similar to Vietnamese by 9th Grade
In terms of 9th grade, the demographic groups most similar to Vietnamese are Houma (92.3%, a difference of 0.020%), Immigrants from Portugal (92.2%, a difference of 0.040%), Immigrants from Fiji (92.3%, a difference of 0.050%), Immigrants from Caribbean (92.2%, a difference of 0.050%), and Immigrants from Cambodia (92.4%, a difference of 0.080%).
| Demographics | Rating | Rank | 9th Grade |
| Immigrants | Vietnam | 0.0 /100 | #306 | Tragic 92.6% |
| Immigrants | Immigrants | 0.0 /100 | #307 | Tragic 92.5% |
| Immigrants | Guyana | 0.0 /100 | #308 | Tragic 92.5% |
| Immigrants | Bangladesh | 0.0 /100 | #309 | Tragic 92.4% |
| Immigrants | Cambodia | 0.0 /100 | #310 | Tragic 92.4% |
| Immigrants | Fiji | 0.0 /100 | #311 | Tragic 92.3% |
| Houma | 0.0 /100 | #312 | Tragic 92.3% |
| Vietnamese | 0.0 /100 | #313 | Tragic 92.3% |
| Immigrants | Portugal | 0.0 /100 | #314 | Tragic 92.2% |
| Immigrants | Caribbean | 0.0 /100 | #315 | Tragic 92.2% |
| Cape Verdeans | 0.0 /100 | #316 | Tragic 92.2% |
| Immigrants | Cuba | 0.0 /100 | #317 | Tragic 92.2% |
| Nepalese | 0.0 /100 | #318 | Tragic 92.0% |
| Ecuadorians | 0.0 /100 | #319 | Tragic 91.9% |
| Nicaraguans | 0.0 /100 | #320 | Tragic 91.9% |