Comanche vs Vietnamese Unemployment Among Ages 60 to 64 years
COMPARE
Comanche
Vietnamese
Unemployment Among Ages 60 to 64 years
Unemployment Among Ages 60 to 64 years Comparison
Comanche
Vietnamese
5.0%
UNEMPLOYMENT AMONG AGES 60 TO 64 YEARS
1.3/ 100
METRIC RATING
245th/ 347
METRIC RANK
6.1%
UNEMPLOYMENT AMONG AGES 60 TO 64 YEARS
0.0/ 100
METRIC RATING
335th/ 347
METRIC RANK
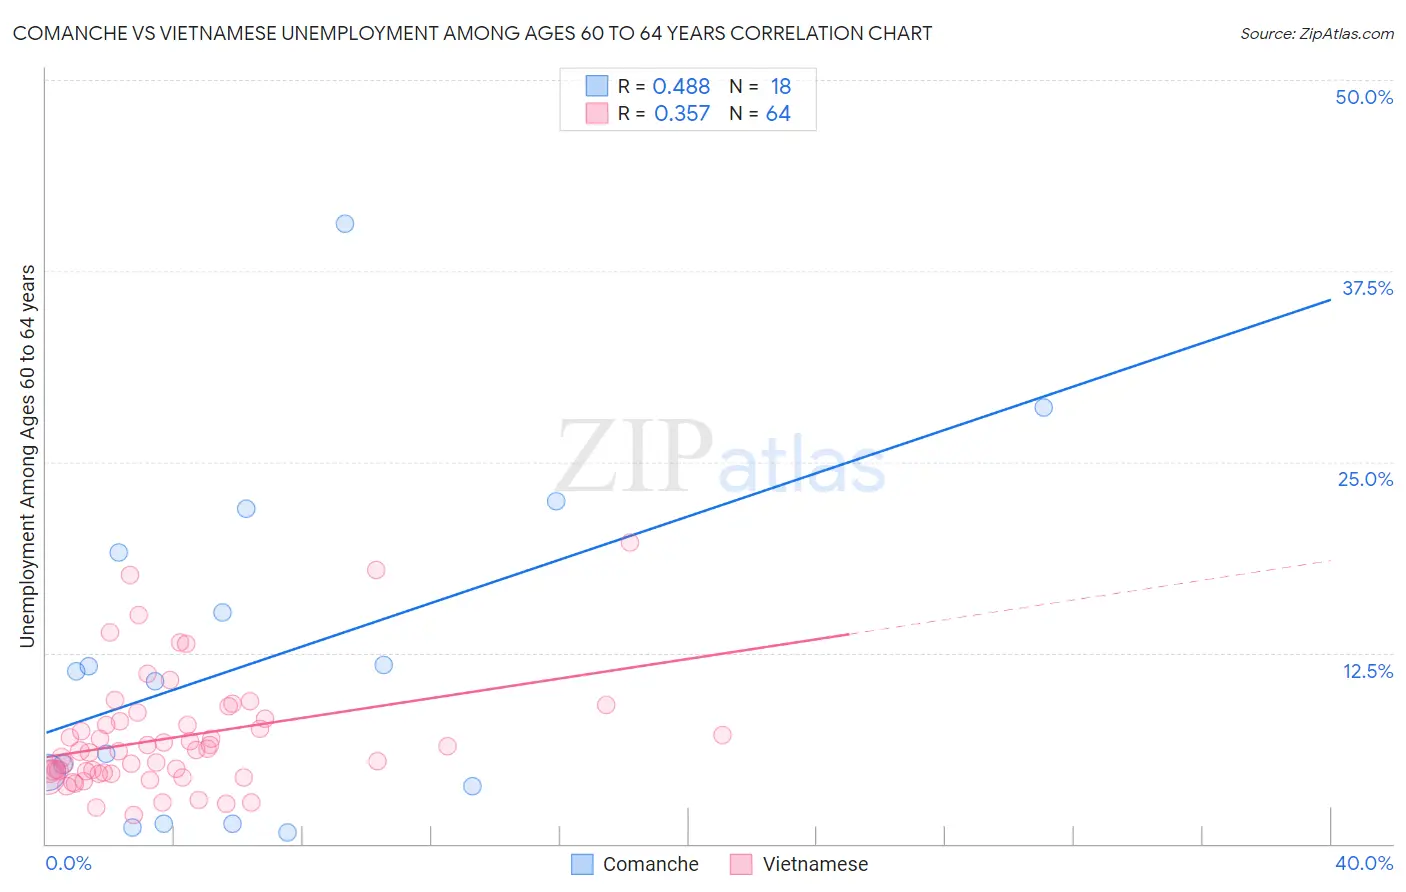
Comanche vs Vietnamese Unemployment Among Ages 60 to 64 years Correlation Chart
The statistical analysis conducted on geographies consisting of 104,335,928 people shows a moderate positive correlation between the proportion of Comanche and unemployment rate among population between the ages 60 and 64 in the United States with a correlation coefficient (R) of 0.488 and weighted average of 5.0%. Similarly, the statistical analysis conducted on geographies consisting of 163,720,441 people shows a mild positive correlation between the proportion of Vietnamese and unemployment rate among population between the ages 60 and 64 in the United States with a correlation coefficient (R) of 0.357 and weighted average of 6.1%, a difference of 20.6%.
Unemployment Among Ages 60 to 64 years Correlation Summary
| Measurement | Comanche | Vietnamese |
| Minimum | 0.70% | 1.9% |
| Maximum | 40.6% | 19.7% |
| Range | 39.9% | 17.8% |
| Mean | 12.1% | 7.0% |
| Median | 11.0% | 6.1% |
| Interquartile 25% (IQ1) | 3.8% | 4.6% |
| Interquartile 75% (IQ3) | 19.1% | 8.1% |
| Interquartile Range (IQR) | 15.3% | 3.4% |
| Standard Deviation (Sample) | 11.0% | 3.8% |
| Standard Deviation (Population) | 10.6% | 3.7% |
Similar Demographics by Unemployment Among Ages 60 to 64 years
Demographics Similar to Comanche by Unemployment Among Ages 60 to 64 years
In terms of unemployment among ages 60 to 64 years, the demographic groups most similar to Comanche are Immigrants from South America (5.0%, a difference of 0.13%), Immigrants from North Macedonia (5.0%, a difference of 0.13%), Peruvian (5.0%, a difference of 0.17%), Immigrants from Fiji (5.1%, a difference of 0.18%), and South American (5.1%, a difference of 0.21%).
| Demographics | Rating | Rank | Unemployment Among Ages 60 to 64 years |
| Immigrants | Poland | 3.0 /100 | #238 | Tragic 5.0% |
| Ghanaians | 2.4 /100 | #239 | Tragic 5.0% |
| Immigrants | Croatia | 2.2 /100 | #240 | Tragic 5.0% |
| Indians (Asian) | 2.2 /100 | #241 | Tragic 5.0% |
| Argentineans | 2.1 /100 | #242 | Tragic 5.0% |
| Immigrants | Philippines | 1.9 /100 | #243 | Tragic 5.0% |
| Peruvians | 1.6 /100 | #244 | Tragic 5.0% |
| Comanche | 1.3 /100 | #245 | Tragic 5.0% |
| Immigrants | South America | 1.1 /100 | #246 | Tragic 5.0% |
| Immigrants | North Macedonia | 1.1 /100 | #247 | Tragic 5.0% |
| Immigrants | Fiji | 1.1 /100 | #248 | Tragic 5.1% |
| South Americans | 1.0 /100 | #249 | Tragic 5.1% |
| Immigrants | Cambodia | 0.9 /100 | #250 | Tragic 5.1% |
| Immigrants | Uruguay | 0.9 /100 | #251 | Tragic 5.1% |
| Immigrants | Switzerland | 0.9 /100 | #252 | Tragic 5.1% |
Demographics Similar to Vietnamese by Unemployment Among Ages 60 to 64 years
In terms of unemployment among ages 60 to 64 years, the demographic groups most similar to Vietnamese are Puerto Rican (6.1%, a difference of 0.19%), Immigrants from Dominican Republic (6.0%, a difference of 1.4%), Dominican (6.0%, a difference of 1.8%), Yakama (6.0%, a difference of 1.8%), and Immigrants from Armenia (6.0%, a difference of 1.9%).
| Demographics | Rating | Rank | Unemployment Among Ages 60 to 64 years |
| Apache | 0.0 /100 | #328 | Tragic 6.0% |
| Immigrants | Bangladesh | 0.0 /100 | #329 | Tragic 6.0% |
| Immigrants | Armenia | 0.0 /100 | #330 | Tragic 6.0% |
| Yakama | 0.0 /100 | #331 | Tragic 6.0% |
| Dominicans | 0.0 /100 | #332 | Tragic 6.0% |
| Immigrants | Dominican Republic | 0.0 /100 | #333 | Tragic 6.0% |
| Puerto Ricans | 0.0 /100 | #334 | Tragic 6.1% |
| Vietnamese | 0.0 /100 | #335 | Tragic 6.1% |
| Kiowa | 0.0 /100 | #336 | Tragic 6.2% |
| Navajo | 0.0 /100 | #337 | Tragic 6.3% |
| Arapaho | 0.0 /100 | #338 | Tragic 6.3% |
| Tlingit-Haida | 0.0 /100 | #339 | Tragic 6.4% |
| Pueblo | 0.0 /100 | #340 | Tragic 6.7% |
| Yuman | 0.0 /100 | #341 | Tragic 6.8% |
| Aleuts | 0.0 /100 | #342 | Tragic 6.8% |