Immigrants from Eritrea vs Vietnamese 9th Grade
COMPARE
Immigrants from Eritrea
Vietnamese
9th Grade
9th Grade Comparison
Immigrants from Eritrea
Vietnamese
93.7%
9TH GRADE
0.1/ 100
METRIC RATING
278th/ 347
METRIC RANK
92.3%
9TH GRADE
0.0/ 100
METRIC RATING
313th/ 347
METRIC RANK
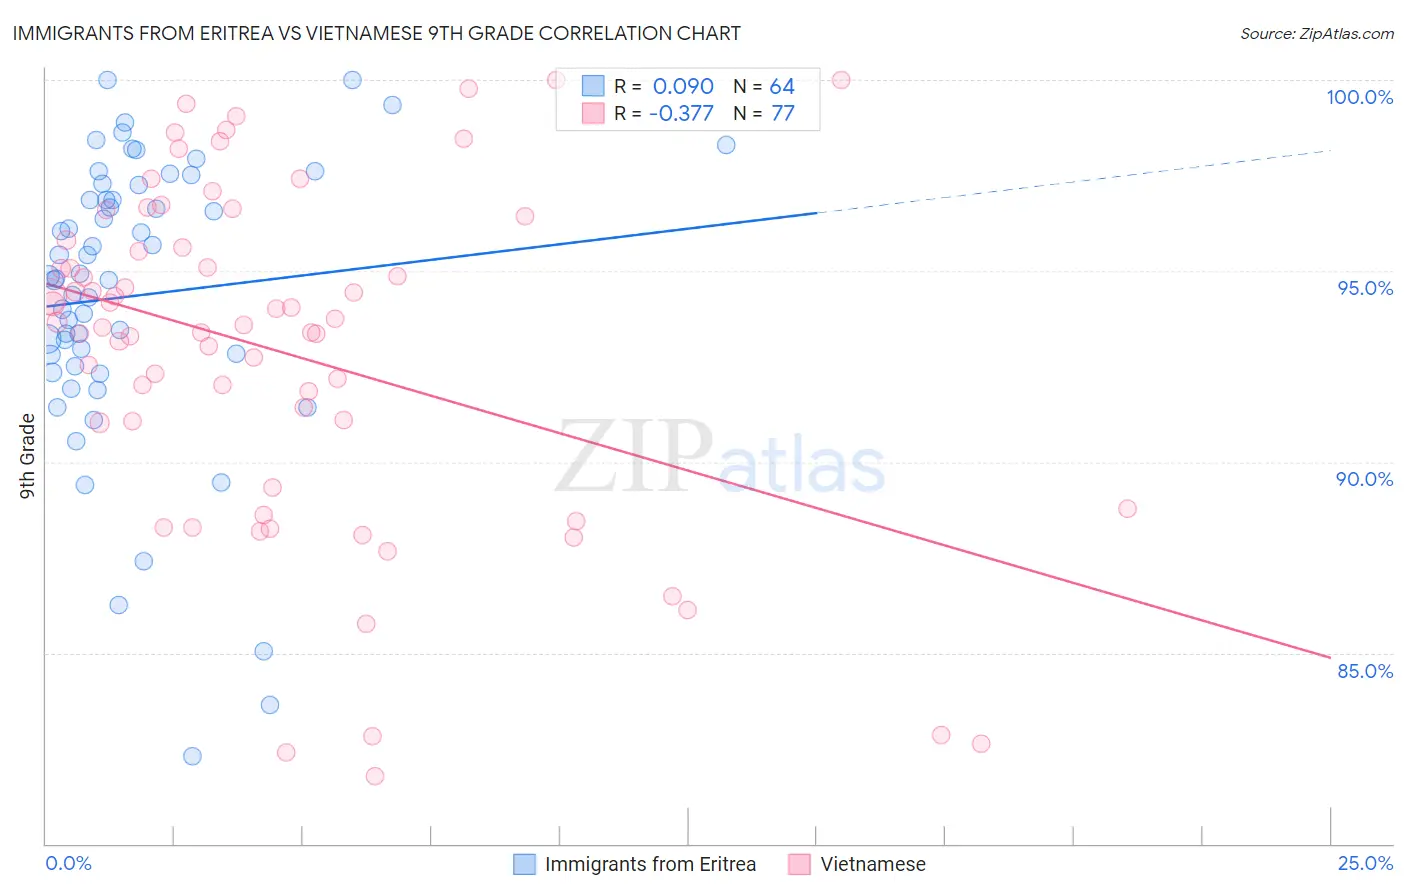
Immigrants from Eritrea vs Vietnamese 9th Grade Correlation Chart
The statistical analysis conducted on geographies consisting of 104,754,230 people shows a slight positive correlation between the proportion of Immigrants from Eritrea and percentage of population with at least 9th grade education in the United States with a correlation coefficient (R) of 0.090 and weighted average of 93.7%. Similarly, the statistical analysis conducted on geographies consisting of 170,728,240 people shows a mild negative correlation between the proportion of Vietnamese and percentage of population with at least 9th grade education in the United States with a correlation coefficient (R) of -0.377 and weighted average of 92.3%, a difference of 1.6%.
9th Grade Correlation Summary
| Measurement | Immigrants from Eritrea | Vietnamese |
| Minimum | 82.3% | 81.8% |
| Maximum | 100.0% | 100.0% |
| Range | 17.7% | 18.2% |
| Mean | 94.3% | 92.9% |
| Median | 94.8% | 93.6% |
| Interquartile 25% (IQ1) | 92.7% | 90.2% |
| Interquartile 75% (IQ3) | 97.1% | 95.7% |
| Interquartile Range (IQR) | 4.4% | 5.5% |
| Standard Deviation (Sample) | 3.8% | 4.4% |
| Standard Deviation (Population) | 3.8% | 4.4% |
Similar Demographics by 9th Grade
Demographics Similar to Immigrants from Eritrea by 9th Grade
In terms of 9th grade, the demographic groups most similar to Immigrants from Eritrea are Immigrants from Philippines (93.7%, a difference of 0.0%), West Indian (93.7%, a difference of 0.010%), Immigrants from Colombia (93.8%, a difference of 0.030%), Immigrants from South America (93.8%, a difference of 0.040%), and Peruvian (93.8%, a difference of 0.040%).
| Demographics | Rating | Rank | 9th Grade |
| Immigrants | Ghana | 0.2 /100 | #271 | Tragic 93.8% |
| Immigrants | Western Africa | 0.2 /100 | #272 | Tragic 93.8% |
| Immigrants | South America | 0.2 /100 | #273 | Tragic 93.8% |
| Peruvians | 0.2 /100 | #274 | Tragic 93.8% |
| Immigrants | Colombia | 0.2 /100 | #275 | Tragic 93.8% |
| West Indians | 0.2 /100 | #276 | Tragic 93.7% |
| Immigrants | Philippines | 0.1 /100 | #277 | Tragic 93.7% |
| Immigrants | Eritrea | 0.1 /100 | #278 | Tragic 93.7% |
| Trinidadians and Tobagonians | 0.1 /100 | #279 | Tragic 93.7% |
| Taiwanese | 0.1 /100 | #280 | Tragic 93.6% |
| Immigrants | Trinidad and Tobago | 0.1 /100 | #281 | Tragic 93.6% |
| Malaysians | 0.0 /100 | #282 | Tragic 93.5% |
| Barbadians | 0.0 /100 | #283 | Tragic 93.5% |
| Bangladeshis | 0.0 /100 | #284 | Tragic 93.4% |
| Immigrants | Peru | 0.0 /100 | #285 | Tragic 93.4% |
Demographics Similar to Vietnamese by 9th Grade
In terms of 9th grade, the demographic groups most similar to Vietnamese are Houma (92.3%, a difference of 0.020%), Immigrants from Portugal (92.2%, a difference of 0.040%), Immigrants from Fiji (92.3%, a difference of 0.050%), Immigrants from Caribbean (92.2%, a difference of 0.050%), and Immigrants from Cambodia (92.4%, a difference of 0.080%).
| Demographics | Rating | Rank | 9th Grade |
| Immigrants | Vietnam | 0.0 /100 | #306 | Tragic 92.6% |
| Immigrants | Immigrants | 0.0 /100 | #307 | Tragic 92.5% |
| Immigrants | Guyana | 0.0 /100 | #308 | Tragic 92.5% |
| Immigrants | Bangladesh | 0.0 /100 | #309 | Tragic 92.4% |
| Immigrants | Cambodia | 0.0 /100 | #310 | Tragic 92.4% |
| Immigrants | Fiji | 0.0 /100 | #311 | Tragic 92.3% |
| Houma | 0.0 /100 | #312 | Tragic 92.3% |
| Vietnamese | 0.0 /100 | #313 | Tragic 92.3% |
| Immigrants | Portugal | 0.0 /100 | #314 | Tragic 92.2% |
| Immigrants | Caribbean | 0.0 /100 | #315 | Tragic 92.2% |
| Cape Verdeans | 0.0 /100 | #316 | Tragic 92.2% |
| Immigrants | Cuba | 0.0 /100 | #317 | Tragic 92.2% |
| Nepalese | 0.0 /100 | #318 | Tragic 92.0% |
| Ecuadorians | 0.0 /100 | #319 | Tragic 91.9% |
| Nicaraguans | 0.0 /100 | #320 | Tragic 91.9% |