Comanche vs Croatian 9th Grade
COMPARE
Comanche
Croatian
9th Grade
9th Grade Comparison
Comanche
Croatians
94.6%
9TH GRADE
14.9/ 100
METRIC RATING
209th/ 347
METRIC RANK
96.5%
9TH GRADE
100.0/ 100
METRIC RATING
16th/ 347
METRIC RANK
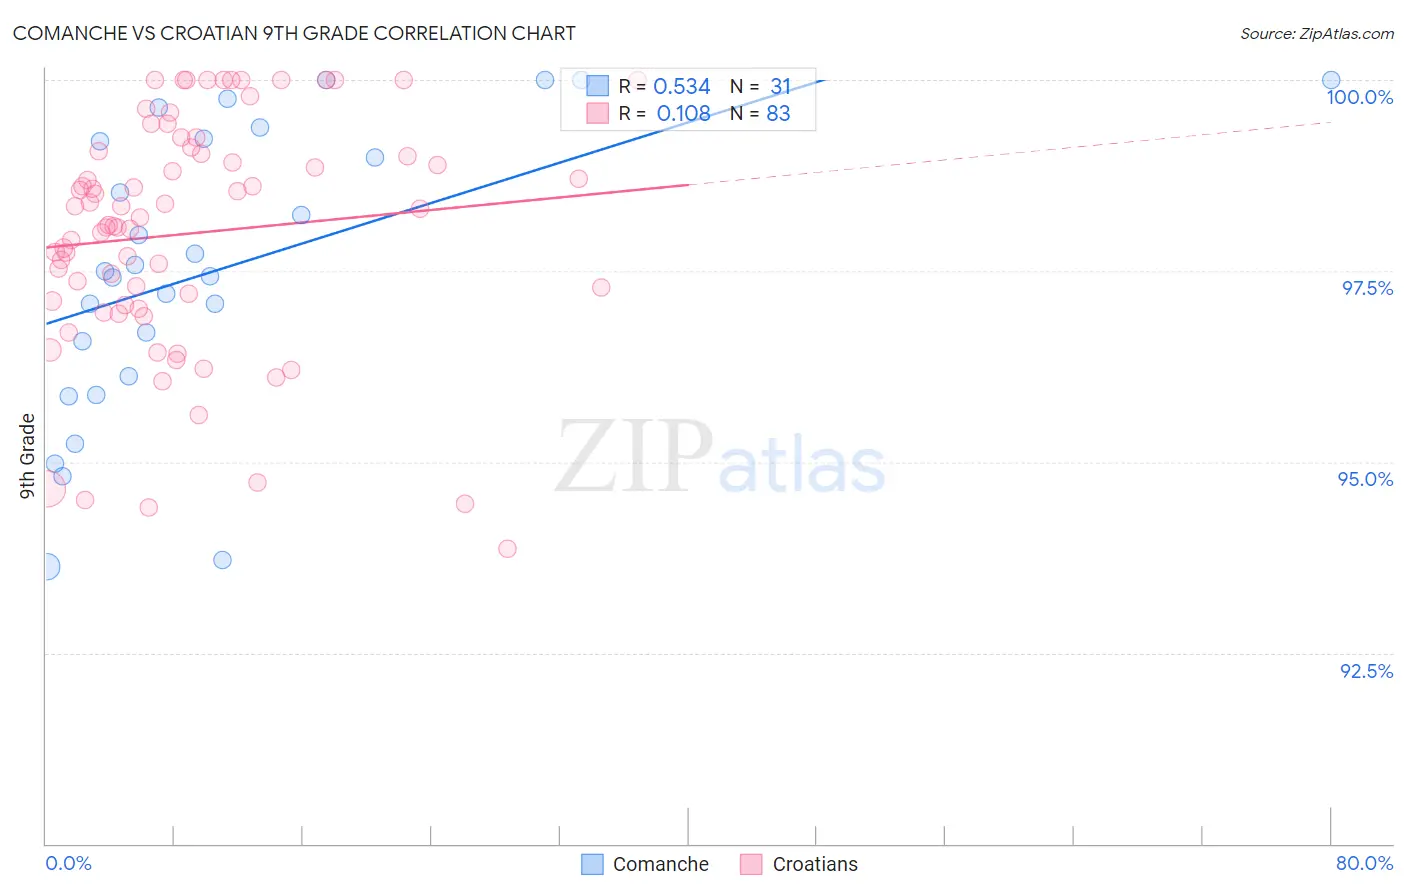
Comanche vs Croatian 9th Grade Correlation Chart
The statistical analysis conducted on geographies consisting of 109,786,530 people shows a substantial positive correlation between the proportion of Comanche and percentage of population with at least 9th grade education in the United States with a correlation coefficient (R) of 0.534 and weighted average of 94.6%. Similarly, the statistical analysis conducted on geographies consisting of 375,734,264 people shows a poor positive correlation between the proportion of Croatians and percentage of population with at least 9th grade education in the United States with a correlation coefficient (R) of 0.108 and weighted average of 96.5%, a difference of 2.1%.
9th Grade Correlation Summary
| Measurement | Comanche | Croatian |
| Minimum | 93.6% | 93.9% |
| Maximum | 100.0% | 100.0% |
| Range | 6.4% | 6.1% |
| Mean | 97.5% | 98.0% |
| Median | 97.5% | 98.2% |
| Interquartile 25% (IQ1) | 96.1% | 97.1% |
| Interquartile 75% (IQ3) | 99.2% | 99.1% |
| Interquartile Range (IQR) | 3.1% | 2.0% |
| Standard Deviation (Sample) | 1.9% | 1.5% |
| Standard Deviation (Population) | 1.8% | 1.5% |
Similar Demographics by 9th Grade
Demographics Similar to Comanche by 9th Grade
In terms of 9th grade, the demographic groups most similar to Comanche are Immigrants from Pakistan (94.6%, a difference of 0.010%), Immigrants from Morocco (94.6%, a difference of 0.020%), Immigrants from Chile (94.5%, a difference of 0.020%), Samoan (94.6%, a difference of 0.030%), and Immigrants from Sudan (94.6%, a difference of 0.040%).
| Demographics | Rating | Rank | 9th Grade |
| Immigrants | Eastern Asia | 19.8 /100 | #202 | Poor 94.6% |
| Immigrants | Bahamas | 19.8 /100 | #203 | Poor 94.6% |
| Moroccans | 19.6 /100 | #204 | Poor 94.6% |
| Immigrants | Sudan | 17.6 /100 | #205 | Poor 94.6% |
| Samoans | 17.3 /100 | #206 | Poor 94.6% |
| Immigrants | Morocco | 16.3 /100 | #207 | Poor 94.6% |
| Immigrants | Pakistan | 15.5 /100 | #208 | Poor 94.6% |
| Comanche | 14.9 /100 | #209 | Poor 94.6% |
| Immigrants | Chile | 13.4 /100 | #210 | Poor 94.5% |
| Immigrants | Indonesia | 12.3 /100 | #211 | Poor 94.5% |
| Immigrants | Malaysia | 12.2 /100 | #212 | Poor 94.5% |
| Immigrants | Oceania | 12.1 /100 | #213 | Poor 94.5% |
| Immigrants | Liberia | 11.8 /100 | #214 | Poor 94.5% |
| Immigrants | Syria | 11.0 /100 | #215 | Poor 94.5% |
| Immigrants | Western Asia | 10.7 /100 | #216 | Poor 94.5% |
Demographics Similar to Croatians by 9th Grade
In terms of 9th grade, the demographic groups most similar to Croatians are Scottish (96.5%, a difference of 0.0%), Irish (96.5%, a difference of 0.0%), Danish (96.5%, a difference of 0.010%), English (96.6%, a difference of 0.050%), and Dutch (96.5%, a difference of 0.060%).
| Demographics | Rating | Rank | 9th Grade |
| Tlingit-Haida | 100.0 /100 | #9 | Exceptional 96.6% |
| Lithuanians | 100.0 /100 | #10 | Exceptional 96.6% |
| Finns | 100.0 /100 | #11 | Exceptional 96.6% |
| English | 100.0 /100 | #12 | Exceptional 96.6% |
| Danes | 100.0 /100 | #13 | Exceptional 96.5% |
| Scottish | 100.0 /100 | #14 | Exceptional 96.5% |
| Irish | 100.0 /100 | #15 | Exceptional 96.5% |
| Croatians | 100.0 /100 | #16 | Exceptional 96.5% |
| Dutch | 100.0 /100 | #17 | Exceptional 96.5% |
| Scandinavians | 100.0 /100 | #18 | Exceptional 96.5% |
| Welsh | 100.0 /100 | #19 | Exceptional 96.4% |
| Italians | 100.0 /100 | #20 | Exceptional 96.4% |
| Alaskan Athabascans | 100.0 /100 | #21 | Exceptional 96.4% |
| Europeans | 100.0 /100 | #22 | Exceptional 96.4% |
| Czechs | 100.0 /100 | #23 | Exceptional 96.4% |