Comanche vs Immigrants from Switzerland Professional Degree
COMPARE
Comanche
Immigrants from Switzerland
Professional Degree
Professional Degree Comparison
Comanche
Immigrants from Switzerland
3.5%
PROFESSIONAL DEGREE
0.4/ 100
METRIC RATING
283rd/ 347
METRIC RANK
7.1%
PROFESSIONAL DEGREE
100.0/ 100
METRIC RATING
8th/ 347
METRIC RANK
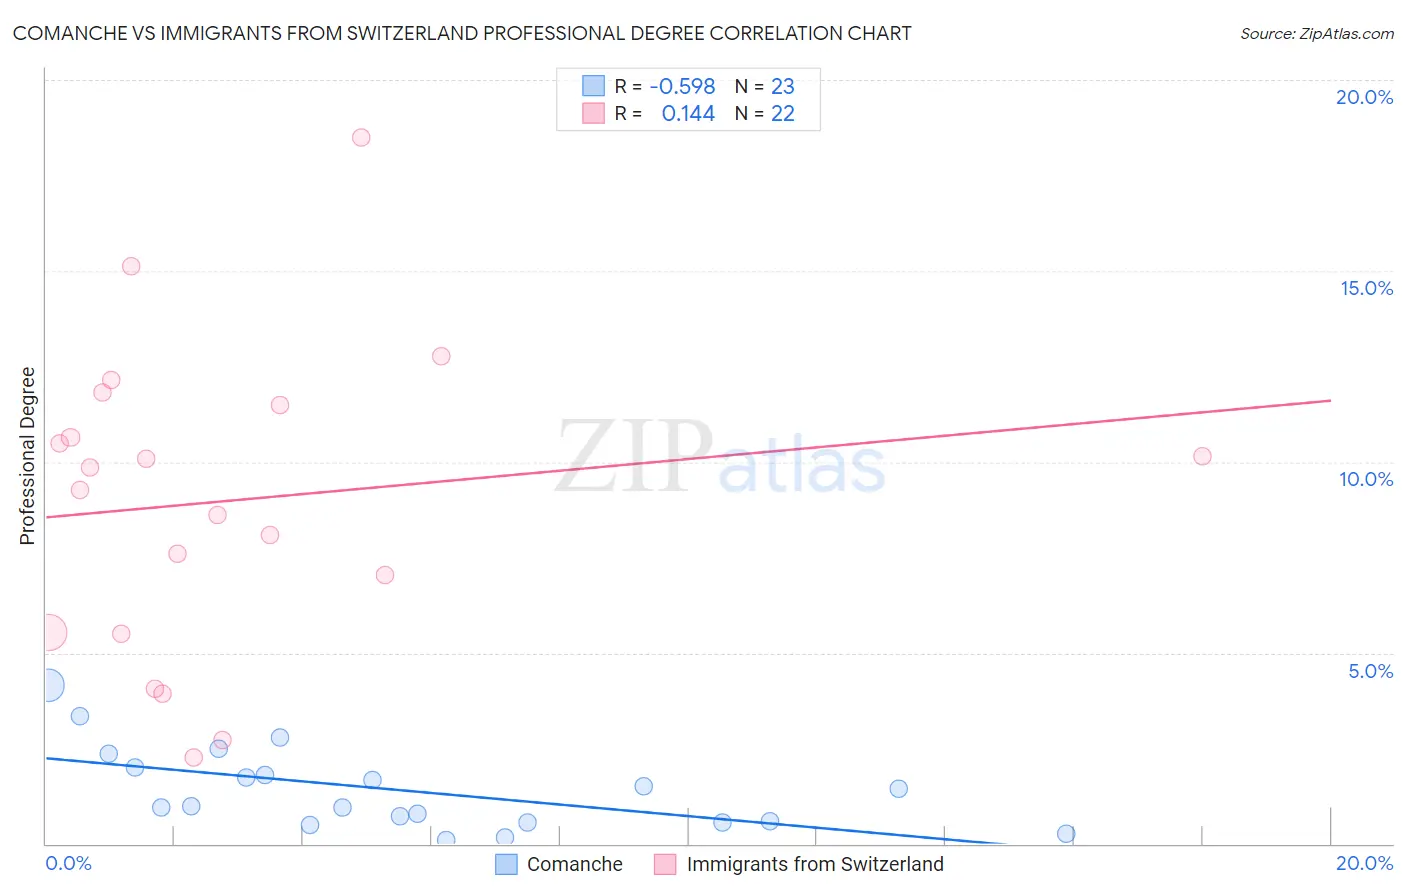
Comanche vs Immigrants from Switzerland Professional Degree Correlation Chart
The statistical analysis conducted on geographies consisting of 109,559,847 people shows a substantial negative correlation between the proportion of Comanche and percentage of population with at least professional degree education in the United States with a correlation coefficient (R) of -0.598 and weighted average of 3.5%. Similarly, the statistical analysis conducted on geographies consisting of 148,038,589 people shows a poor positive correlation between the proportion of Immigrants from Switzerland and percentage of population with at least professional degree education in the United States with a correlation coefficient (R) of 0.144 and weighted average of 7.1%, a difference of 100.5%.
Professional Degree Correlation Summary
| Measurement | Comanche | Immigrants from Switzerland |
| Minimum | 0.11% | 2.3% |
| Maximum | 4.1% | 18.5% |
| Range | 4.0% | 16.2% |
| Mean | 1.4% | 9.0% |
| Median | 0.97% | 9.6% |
| Interquartile 25% (IQ1) | 0.57% | 5.5% |
| Interquartile 75% (IQ3) | 2.0% | 11.5% |
| Interquartile Range (IQR) | 1.4% | 5.9% |
| Standard Deviation (Sample) | 1.1% | 4.0% |
| Standard Deviation (Population) | 1.0% | 3.9% |
Similar Demographics by Professional Degree
Demographics Similar to Comanche by Professional Degree
In terms of professional degree, the demographic groups most similar to Comanche are Salvadoran (3.5%, a difference of 0.10%), Immigrants from Caribbean (3.5%, a difference of 0.30%), Apache (3.5%, a difference of 0.32%), Dominican (3.5%, a difference of 0.34%), and Immigrants from Portugal (3.5%, a difference of 0.38%).
| Demographics | Rating | Rank | Professional Degree |
| Liberians | 0.5 /100 | #276 | Tragic 3.6% |
| Cheyenne | 0.5 /100 | #277 | Tragic 3.6% |
| Japanese | 0.5 /100 | #278 | Tragic 3.5% |
| Immigrants | Portugal | 0.5 /100 | #279 | Tragic 3.5% |
| Dominicans | 0.5 /100 | #280 | Tragic 3.5% |
| Apache | 0.5 /100 | #281 | Tragic 3.5% |
| Immigrants | Caribbean | 0.5 /100 | #282 | Tragic 3.5% |
| Comanche | 0.4 /100 | #283 | Tragic 3.5% |
| Salvadorans | 0.4 /100 | #284 | Tragic 3.5% |
| Hondurans | 0.3 /100 | #285 | Tragic 3.5% |
| Haitians | 0.3 /100 | #286 | Tragic 3.5% |
| Immigrants | El Salvador | 0.3 /100 | #287 | Tragic 3.5% |
| Blackfeet | 0.3 /100 | #288 | Tragic 3.5% |
| Guatemalans | 0.3 /100 | #289 | Tragic 3.5% |
| Chippewa | 0.3 /100 | #290 | Tragic 3.5% |
Demographics Similar to Immigrants from Switzerland by Professional Degree
In terms of professional degree, the demographic groups most similar to Immigrants from Switzerland are Eastern European (7.1%, a difference of 0.14%), Immigrants from Taiwan (7.1%, a difference of 0.19%), Immigrants from Belgium (7.0%, a difference of 1.9%), Cypriot (6.9%, a difference of 2.1%), and Israeli (6.9%, a difference of 2.2%).
| Demographics | Rating | Rank | Professional Degree |
| Immigrants | Israel | 100.0 /100 | #1 | Exceptional 7.9% |
| Immigrants | Singapore | 100.0 /100 | #2 | Exceptional 7.7% |
| Iranians | 100.0 /100 | #3 | Exceptional 7.6% |
| Filipinos | 100.0 /100 | #4 | Exceptional 7.6% |
| Immigrants | Iran | 100.0 /100 | #5 | Exceptional 7.3% |
| Okinawans | 100.0 /100 | #6 | Exceptional 7.3% |
| Eastern Europeans | 100.0 /100 | #7 | Exceptional 7.1% |
| Immigrants | Switzerland | 100.0 /100 | #8 | Exceptional 7.1% |
| Immigrants | Taiwan | 100.0 /100 | #9 | Exceptional 7.1% |
| Immigrants | Belgium | 100.0 /100 | #10 | Exceptional 7.0% |
| Cypriots | 100.0 /100 | #11 | Exceptional 6.9% |
| Israelis | 100.0 /100 | #12 | Exceptional 6.9% |
| Immigrants | Australia | 100.0 /100 | #13 | Exceptional 6.9% |
| Immigrants | France | 100.0 /100 | #14 | Exceptional 6.8% |
| Immigrants | China | 100.0 /100 | #15 | Exceptional 6.7% |