Comanche vs Cree Professional Degree
COMPARE
Comanche
Cree
Professional Degree
Professional Degree Comparison
Comanche
Cree
3.5%
PROFESSIONAL DEGREE
0.4/ 100
METRIC RATING
283rd/ 347
METRIC RANK
3.9%
PROFESSIONAL DEGREE
4.3/ 100
METRIC RATING
232nd/ 347
METRIC RANK
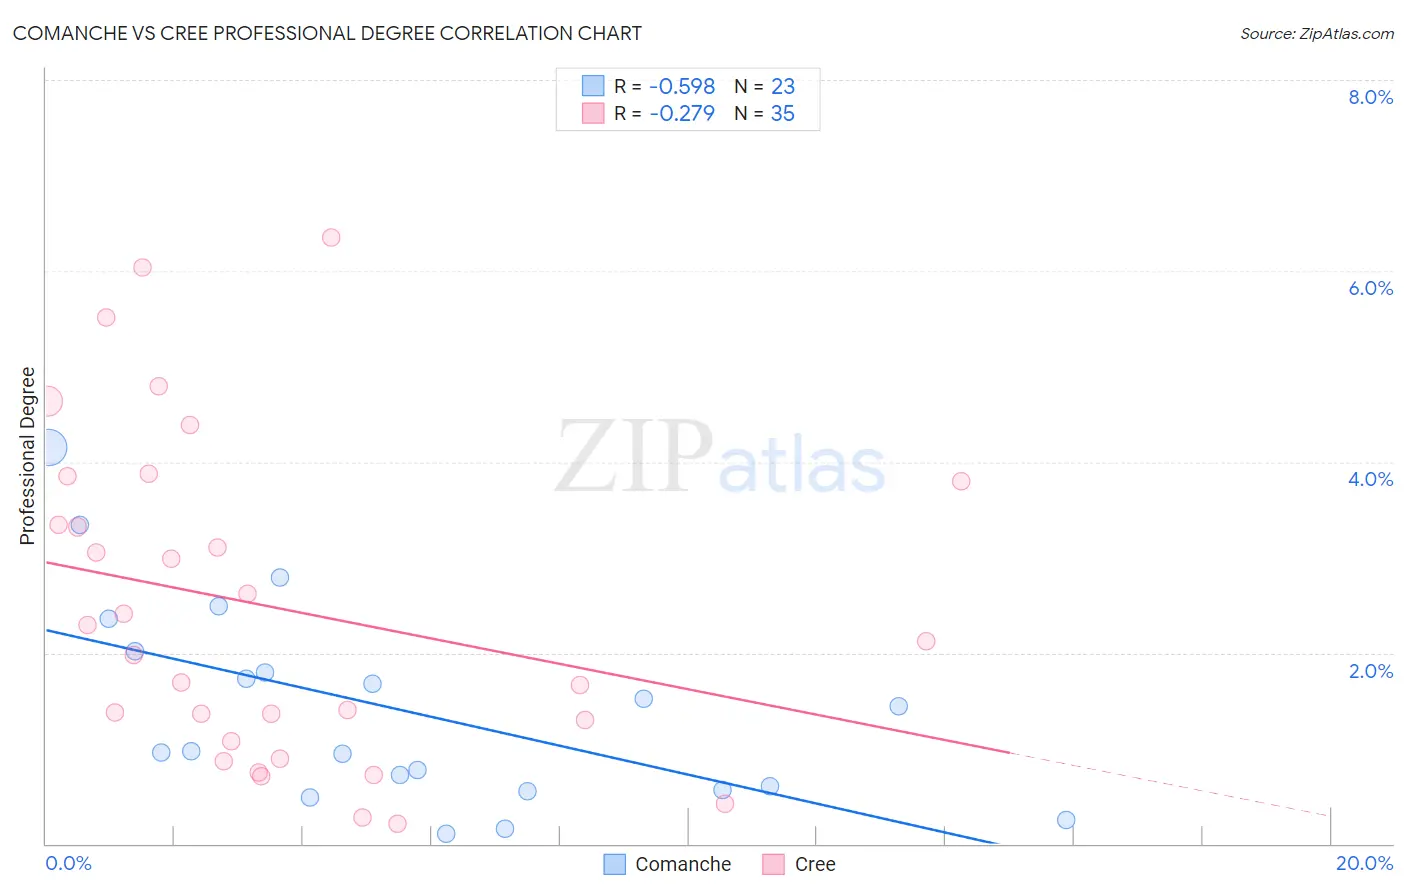
Comanche vs Cree Professional Degree Correlation Chart
The statistical analysis conducted on geographies consisting of 109,559,847 people shows a substantial negative correlation between the proportion of Comanche and percentage of population with at least professional degree education in the United States with a correlation coefficient (R) of -0.598 and weighted average of 3.5%. Similarly, the statistical analysis conducted on geographies consisting of 76,148,984 people shows a weak negative correlation between the proportion of Cree and percentage of population with at least professional degree education in the United States with a correlation coefficient (R) of -0.279 and weighted average of 3.9%, a difference of 10.7%.
Professional Degree Correlation Summary
| Measurement | Comanche | Cree |
| Minimum | 0.11% | 0.20% |
| Maximum | 4.1% | 6.3% |
| Range | 4.0% | 6.1% |
| Mean | 1.4% | 2.5% |
| Median | 0.97% | 2.1% |
| Interquartile 25% (IQ1) | 0.57% | 1.1% |
| Interquartile 75% (IQ3) | 2.0% | 3.8% |
| Interquartile Range (IQR) | 1.4% | 2.7% |
| Standard Deviation (Sample) | 1.1% | 1.7% |
| Standard Deviation (Population) | 1.0% | 1.7% |
Similar Demographics by Professional Degree
Demographics Similar to Comanche by Professional Degree
In terms of professional degree, the demographic groups most similar to Comanche are Salvadoran (3.5%, a difference of 0.10%), Immigrants from Caribbean (3.5%, a difference of 0.30%), Apache (3.5%, a difference of 0.32%), Dominican (3.5%, a difference of 0.34%), and Immigrants from Portugal (3.5%, a difference of 0.38%).
| Demographics | Rating | Rank | Professional Degree |
| Liberians | 0.5 /100 | #276 | Tragic 3.6% |
| Cheyenne | 0.5 /100 | #277 | Tragic 3.6% |
| Japanese | 0.5 /100 | #278 | Tragic 3.5% |
| Immigrants | Portugal | 0.5 /100 | #279 | Tragic 3.5% |
| Dominicans | 0.5 /100 | #280 | Tragic 3.5% |
| Apache | 0.5 /100 | #281 | Tragic 3.5% |
| Immigrants | Caribbean | 0.5 /100 | #282 | Tragic 3.5% |
| Comanche | 0.4 /100 | #283 | Tragic 3.5% |
| Salvadorans | 0.4 /100 | #284 | Tragic 3.5% |
| Hondurans | 0.3 /100 | #285 | Tragic 3.5% |
| Haitians | 0.3 /100 | #286 | Tragic 3.5% |
| Immigrants | El Salvador | 0.3 /100 | #287 | Tragic 3.5% |
| Blackfeet | 0.3 /100 | #288 | Tragic 3.5% |
| Guatemalans | 0.3 /100 | #289 | Tragic 3.5% |
| Chippewa | 0.3 /100 | #290 | Tragic 3.5% |
Demographics Similar to Cree by Professional Degree
In terms of professional degree, the demographic groups most similar to Cree are Ecuadorian (3.9%, a difference of 0.21%), Immigrants from Philippines (3.9%, a difference of 0.26%), Nonimmigrants (3.9%, a difference of 0.30%), Immigrants from Barbados (3.9%, a difference of 0.31%), and Spanish American (3.9%, a difference of 0.53%).
| Demographics | Rating | Rank | Professional Degree |
| Tlingit-Haida | 6.9 /100 | #225 | Tragic 4.0% |
| German Russians | 6.1 /100 | #226 | Tragic 4.0% |
| Cubans | 5.9 /100 | #227 | Tragic 4.0% |
| Immigrants | West Indies | 5.6 /100 | #228 | Tragic 4.0% |
| Immigrants | Burma/Myanmar | 5.4 /100 | #229 | Tragic 3.9% |
| Nicaraguans | 5.1 /100 | #230 | Tragic 3.9% |
| Ecuadorians | 4.6 /100 | #231 | Tragic 3.9% |
| Cree | 4.3 /100 | #232 | Tragic 3.9% |
| Immigrants | Philippines | 4.1 /100 | #233 | Tragic 3.9% |
| Immigrants | Nonimmigrants | 4.0 /100 | #234 | Tragic 3.9% |
| Immigrants | Barbados | 4.0 /100 | #235 | Tragic 3.9% |
| Spanish Americans | 3.8 /100 | #236 | Tragic 3.9% |
| Immigrants | Trinidad and Tobago | 3.8 /100 | #237 | Tragic 3.9% |
| Colville | 2.6 /100 | #238 | Tragic 3.8% |
| British West Indians | 2.4 /100 | #239 | Tragic 3.8% |