Comanche vs Immigrants from Costa Rica Professional Degree
COMPARE
Comanche
Immigrants from Costa Rica
Professional Degree
Professional Degree Comparison
Comanche
Immigrants from Costa Rica
3.5%
PROFESSIONAL DEGREE
0.4/ 100
METRIC RATING
283rd/ 347
METRIC RANK
4.4%
PROFESSIONAL DEGREE
46.7/ 100
METRIC RATING
178th/ 347
METRIC RANK
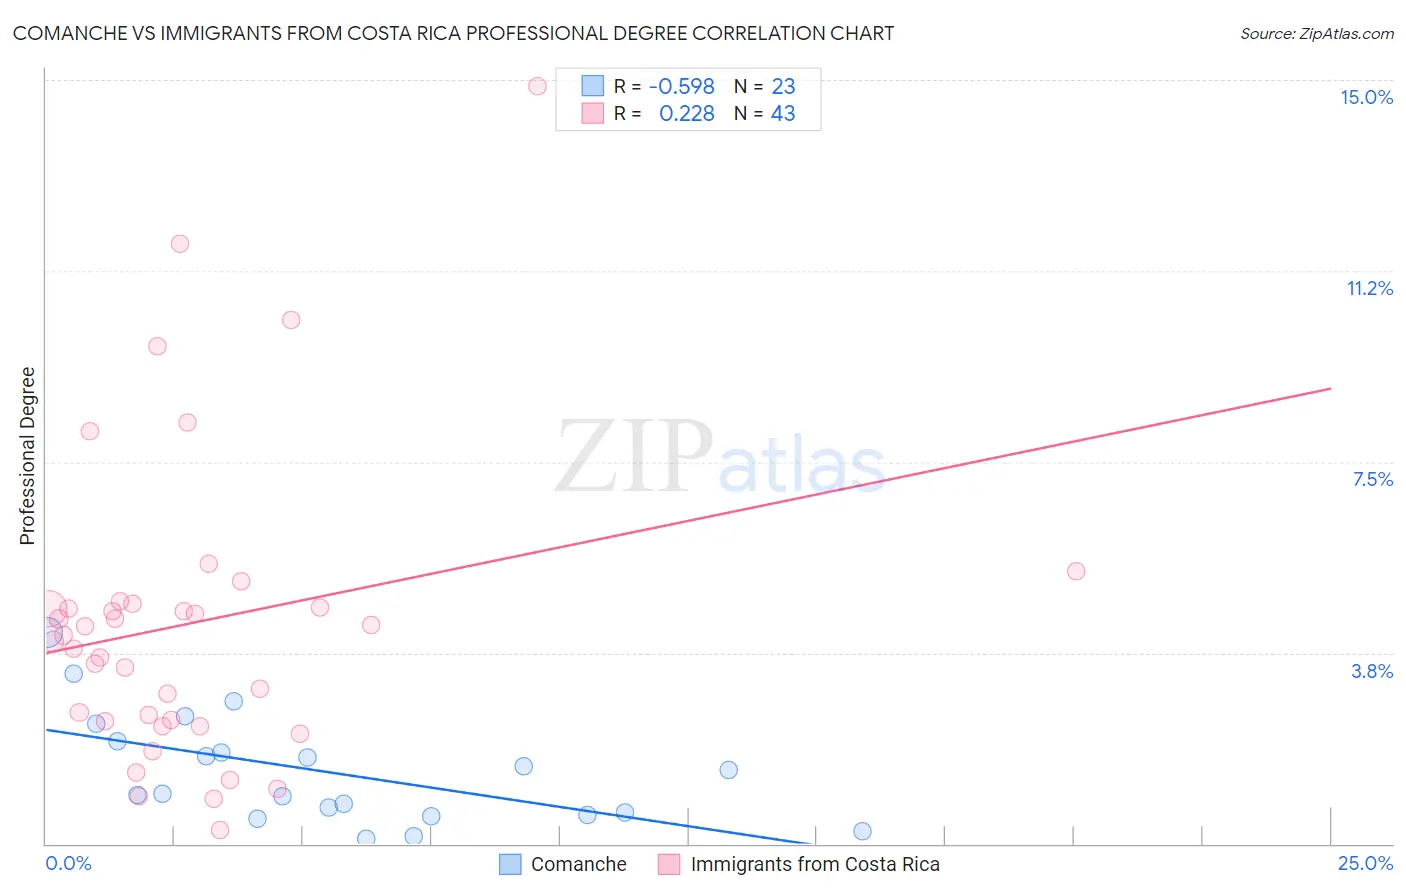
Comanche vs Immigrants from Costa Rica Professional Degree Correlation Chart
The statistical analysis conducted on geographies consisting of 109,559,847 people shows a substantial negative correlation between the proportion of Comanche and percentage of population with at least professional degree education in the United States with a correlation coefficient (R) of -0.598 and weighted average of 3.5%. Similarly, the statistical analysis conducted on geographies consisting of 204,151,669 people shows a weak positive correlation between the proportion of Immigrants from Costa Rica and percentage of population with at least professional degree education in the United States with a correlation coefficient (R) of 0.228 and weighted average of 4.4%, a difference of 24.1%.
Professional Degree Correlation Summary
| Measurement | Comanche | Immigrants from Costa Rica |
| Minimum | 0.11% | 0.26% |
| Maximum | 4.1% | 14.9% |
| Range | 4.0% | 14.6% |
| Mean | 1.4% | 4.3% |
| Median | 0.97% | 4.1% |
| Interquartile 25% (IQ1) | 0.57% | 2.4% |
| Interquartile 75% (IQ3) | 2.0% | 4.7% |
| Interquartile Range (IQR) | 1.4% | 2.3% |
| Standard Deviation (Sample) | 1.1% | 3.0% |
| Standard Deviation (Population) | 1.0% | 2.9% |
Similar Demographics by Professional Degree
Demographics Similar to Comanche by Professional Degree
In terms of professional degree, the demographic groups most similar to Comanche are Salvadoran (3.5%, a difference of 0.10%), Immigrants from Caribbean (3.5%, a difference of 0.30%), Apache (3.5%, a difference of 0.32%), Dominican (3.5%, a difference of 0.34%), and Immigrants from Portugal (3.5%, a difference of 0.38%).
| Demographics | Rating | Rank | Professional Degree |
| Liberians | 0.5 /100 | #276 | Tragic 3.6% |
| Cheyenne | 0.5 /100 | #277 | Tragic 3.6% |
| Japanese | 0.5 /100 | #278 | Tragic 3.5% |
| Immigrants | Portugal | 0.5 /100 | #279 | Tragic 3.5% |
| Dominicans | 0.5 /100 | #280 | Tragic 3.5% |
| Apache | 0.5 /100 | #281 | Tragic 3.5% |
| Immigrants | Caribbean | 0.5 /100 | #282 | Tragic 3.5% |
| Comanche | 0.4 /100 | #283 | Tragic 3.5% |
| Salvadorans | 0.4 /100 | #284 | Tragic 3.5% |
| Hondurans | 0.3 /100 | #285 | Tragic 3.5% |
| Haitians | 0.3 /100 | #286 | Tragic 3.5% |
| Immigrants | El Salvador | 0.3 /100 | #287 | Tragic 3.5% |
| Blackfeet | 0.3 /100 | #288 | Tragic 3.5% |
| Guatemalans | 0.3 /100 | #289 | Tragic 3.5% |
| Chippewa | 0.3 /100 | #290 | Tragic 3.5% |
Demographics Similar to Immigrants from Costa Rica by Professional Degree
In terms of professional degree, the demographic groups most similar to Immigrants from Costa Rica are Immigrants from Kenya (4.4%, a difference of 0.11%), Celtic (4.4%, a difference of 0.13%), Czech (4.4%, a difference of 0.26%), Immigrants from Peru (4.4%, a difference of 0.39%), and Danish (4.4%, a difference of 0.47%).
| Demographics | Rating | Rank | Professional Degree |
| Immigrants | Bangladesh | 56.0 /100 | #171 | Average 4.4% |
| Spaniards | 52.0 /100 | #172 | Average 4.4% |
| English | 50.1 /100 | #173 | Average 4.4% |
| Kenyans | 50.0 /100 | #174 | Average 4.4% |
| Irish | 50.0 /100 | #175 | Average 4.4% |
| Immigrants | Peru | 49.3 /100 | #176 | Average 4.4% |
| Celtics | 47.6 /100 | #177 | Average 4.4% |
| Immigrants | Costa Rica | 46.7 /100 | #178 | Average 4.4% |
| Immigrants | Kenya | 45.9 /100 | #179 | Average 4.4% |
| Czechs | 44.9 /100 | #180 | Average 4.4% |
| Danes | 43.5 /100 | #181 | Average 4.4% |
| Immigrants | Immigrants | 43.2 /100 | #182 | Average 4.4% |
| Bermudans | 43.1 /100 | #183 | Average 4.4% |
| Belgians | 36.2 /100 | #184 | Fair 4.3% |
| Welsh | 35.8 /100 | #185 | Fair 4.3% |