Comanche vs Immigrants from India Professional Degree
COMPARE
Comanche
Immigrants from India
Professional Degree
Professional Degree Comparison
Comanche
Immigrants from India
3.5%
PROFESSIONAL DEGREE
0.4/ 100
METRIC RATING
283rd/ 347
METRIC RANK
6.2%
PROFESSIONAL DEGREE
100.0/ 100
METRIC RATING
31st/ 347
METRIC RANK
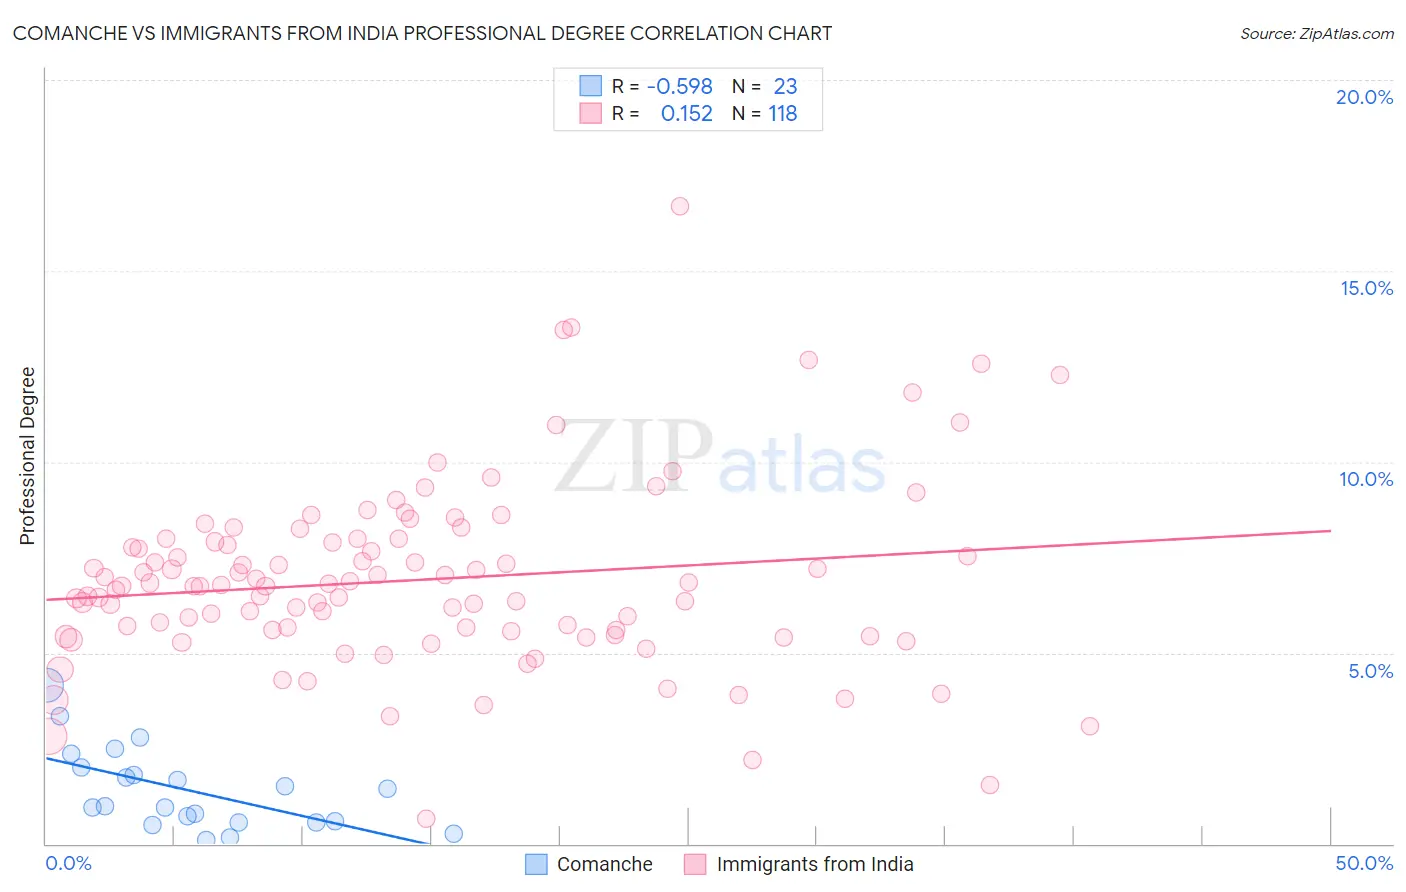
Comanche vs Immigrants from India Professional Degree Correlation Chart
The statistical analysis conducted on geographies consisting of 109,559,847 people shows a substantial negative correlation between the proportion of Comanche and percentage of population with at least professional degree education in the United States with a correlation coefficient (R) of -0.598 and weighted average of 3.5%. Similarly, the statistical analysis conducted on geographies consisting of 433,211,421 people shows a poor positive correlation between the proportion of Immigrants from India and percentage of population with at least professional degree education in the United States with a correlation coefficient (R) of 0.152 and weighted average of 6.2%, a difference of 74.3%.
Professional Degree Correlation Summary
| Measurement | Comanche | Immigrants from India |
| Minimum | 0.11% | 0.66% |
| Maximum | 4.1% | 16.7% |
| Range | 4.0% | 16.0% |
| Mean | 1.4% | 6.9% |
| Median | 0.97% | 6.7% |
| Interquartile 25% (IQ1) | 0.57% | 5.6% |
| Interquartile 75% (IQ3) | 2.0% | 7.9% |
| Interquartile Range (IQR) | 1.4% | 2.3% |
| Standard Deviation (Sample) | 1.1% | 2.4% |
| Standard Deviation (Population) | 1.0% | 2.4% |
Similar Demographics by Professional Degree
Demographics Similar to Comanche by Professional Degree
In terms of professional degree, the demographic groups most similar to Comanche are Salvadoran (3.5%, a difference of 0.10%), Immigrants from Caribbean (3.5%, a difference of 0.30%), Apache (3.5%, a difference of 0.32%), Dominican (3.5%, a difference of 0.34%), and Immigrants from Portugal (3.5%, a difference of 0.38%).
| Demographics | Rating | Rank | Professional Degree |
| Liberians | 0.5 /100 | #276 | Tragic 3.6% |
| Cheyenne | 0.5 /100 | #277 | Tragic 3.6% |
| Japanese | 0.5 /100 | #278 | Tragic 3.5% |
| Immigrants | Portugal | 0.5 /100 | #279 | Tragic 3.5% |
| Dominicans | 0.5 /100 | #280 | Tragic 3.5% |
| Apache | 0.5 /100 | #281 | Tragic 3.5% |
| Immigrants | Caribbean | 0.5 /100 | #282 | Tragic 3.5% |
| Comanche | 0.4 /100 | #283 | Tragic 3.5% |
| Salvadorans | 0.4 /100 | #284 | Tragic 3.5% |
| Hondurans | 0.3 /100 | #285 | Tragic 3.5% |
| Haitians | 0.3 /100 | #286 | Tragic 3.5% |
| Immigrants | El Salvador | 0.3 /100 | #287 | Tragic 3.5% |
| Blackfeet | 0.3 /100 | #288 | Tragic 3.5% |
| Guatemalans | 0.3 /100 | #289 | Tragic 3.5% |
| Chippewa | 0.3 /100 | #290 | Tragic 3.5% |
Demographics Similar to Immigrants from India by Professional Degree
In terms of professional degree, the demographic groups most similar to Immigrants from India are Immigrants from Sri Lanka (6.2%, a difference of 0.12%), Immigrants from Turkey (6.2%, a difference of 0.12%), Thai (6.1%, a difference of 0.23%), Burmese (6.1%, a difference of 0.27%), and Mongolian (6.1%, a difference of 0.40%).
| Demographics | Rating | Rank | Professional Degree |
| Immigrants | Spain | 100.0 /100 | #24 | Exceptional 6.3% |
| Immigrants | Ireland | 100.0 /100 | #25 | Exceptional 6.3% |
| Latvians | 100.0 /100 | #26 | Exceptional 6.2% |
| Immigrants | Northern Europe | 100.0 /100 | #27 | Exceptional 6.2% |
| Turks | 100.0 /100 | #28 | Exceptional 6.2% |
| Immigrants | Sri Lanka | 100.0 /100 | #29 | Exceptional 6.2% |
| Immigrants | Turkey | 100.0 /100 | #30 | Exceptional 6.2% |
| Immigrants | India | 100.0 /100 | #31 | Exceptional 6.2% |
| Thais | 100.0 /100 | #32 | Exceptional 6.1% |
| Burmese | 100.0 /100 | #33 | Exceptional 6.1% |
| Mongolians | 100.0 /100 | #34 | Exceptional 6.1% |
| Immigrants | Korea | 100.0 /100 | #35 | Exceptional 6.1% |
| Immigrants | Russia | 100.0 /100 | #36 | Exceptional 6.0% |
| Immigrants | Austria | 100.0 /100 | #37 | Exceptional 6.0% |
| Immigrants | Norway | 100.0 /100 | #38 | Exceptional 6.0% |