Immigrants from Portugal vs Korean Professional Degree
COMPARE
Immigrants from Portugal
Korean
Professional Degree
Professional Degree Comparison
Immigrants from Portugal
Koreans
3.5%
PROFESSIONAL DEGREE
0.5/ 100
METRIC RATING
279th/ 347
METRIC RANK
4.1%
PROFESSIONAL DEGREE
10.7/ 100
METRIC RATING
213th/ 347
METRIC RANK
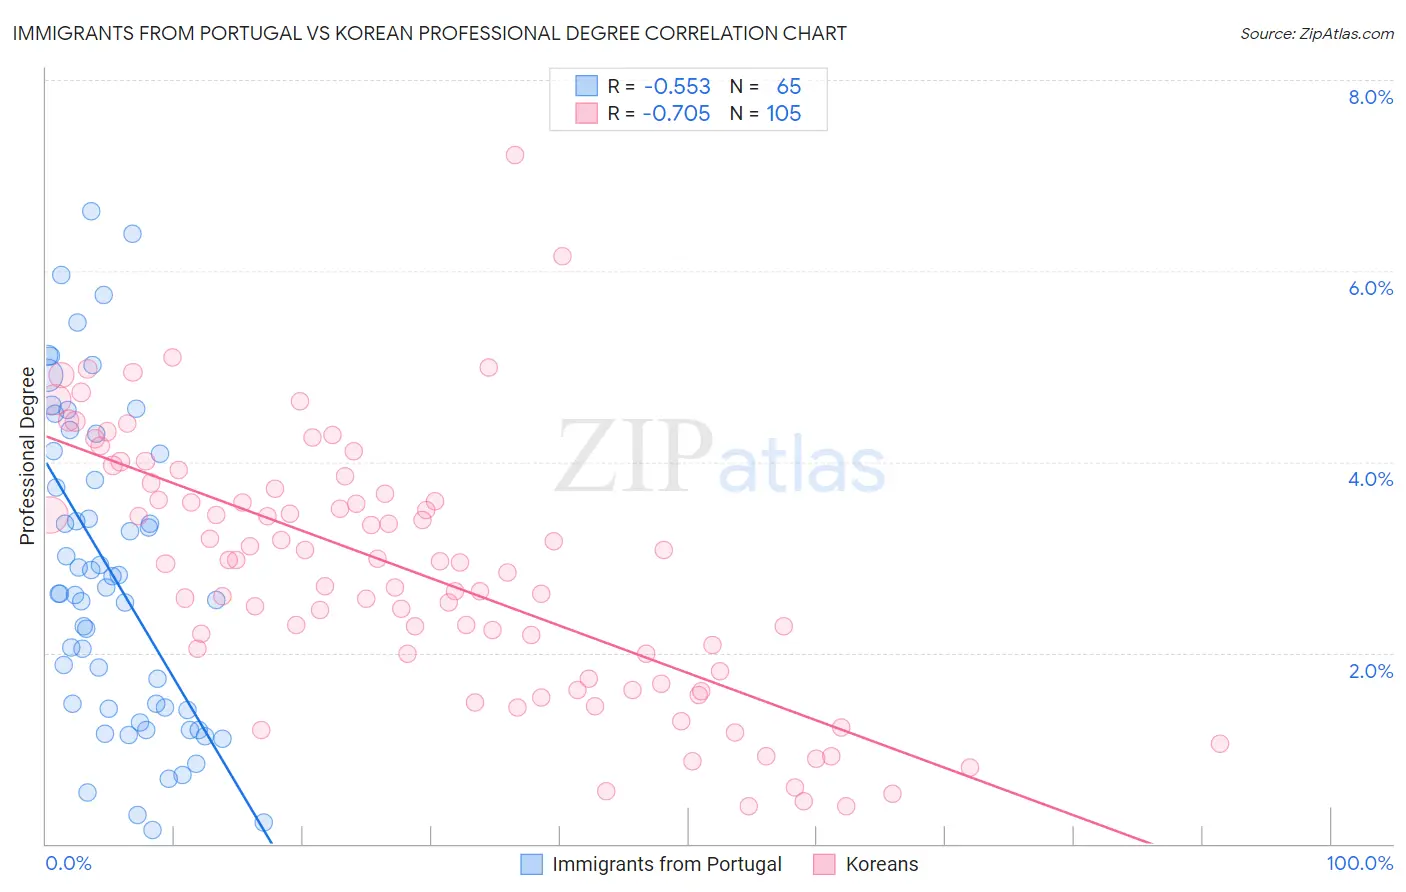
Immigrants from Portugal vs Korean Professional Degree Correlation Chart
The statistical analysis conducted on geographies consisting of 174,657,094 people shows a substantial negative correlation between the proportion of Immigrants from Portugal and percentage of population with at least professional degree education in the United States with a correlation coefficient (R) of -0.553 and weighted average of 3.5%. Similarly, the statistical analysis conducted on geographies consisting of 508,138,227 people shows a strong negative correlation between the proportion of Koreans and percentage of population with at least professional degree education in the United States with a correlation coefficient (R) of -0.705 and weighted average of 4.1%, a difference of 14.7%.
Professional Degree Correlation Summary
| Measurement | Immigrants from Portugal | Korean |
| Minimum | 0.14% | 0.39% |
| Maximum | 6.6% | 7.2% |
| Range | 6.5% | 6.8% |
| Mean | 2.8% | 2.8% |
| Median | 2.6% | 2.9% |
| Interquartile 25% (IQ1) | 1.4% | 1.8% |
| Interquartile 75% (IQ3) | 4.1% | 3.7% |
| Interquartile Range (IQR) | 2.7% | 1.9% |
| Standard Deviation (Sample) | 1.6% | 1.3% |
| Standard Deviation (Population) | 1.6% | 1.3% |
Similar Demographics by Professional Degree
Demographics Similar to Immigrants from Portugal by Professional Degree
In terms of professional degree, the demographic groups most similar to Immigrants from Portugal are Japanese (3.5%, a difference of 0.040%), Dominican (3.5%, a difference of 0.040%), Apache (3.5%, a difference of 0.060%), Immigrants from Caribbean (3.5%, a difference of 0.080%), and Cheyenne (3.6%, a difference of 0.10%).
| Demographics | Rating | Rank | Professional Degree |
| Immigrants | Jamaica | 0.5 /100 | #272 | Tragic 3.6% |
| Americans | 0.5 /100 | #273 | Tragic 3.6% |
| Potawatomi | 0.5 /100 | #274 | Tragic 3.6% |
| Immigrants | Dominica | 0.5 /100 | #275 | Tragic 3.6% |
| Liberians | 0.5 /100 | #276 | Tragic 3.6% |
| Cheyenne | 0.5 /100 | #277 | Tragic 3.6% |
| Japanese | 0.5 /100 | #278 | Tragic 3.5% |
| Immigrants | Portugal | 0.5 /100 | #279 | Tragic 3.5% |
| Dominicans | 0.5 /100 | #280 | Tragic 3.5% |
| Apache | 0.5 /100 | #281 | Tragic 3.5% |
| Immigrants | Caribbean | 0.5 /100 | #282 | Tragic 3.5% |
| Comanche | 0.4 /100 | #283 | Tragic 3.5% |
| Salvadorans | 0.4 /100 | #284 | Tragic 3.5% |
| Hondurans | 0.3 /100 | #285 | Tragic 3.5% |
| Haitians | 0.3 /100 | #286 | Tragic 3.5% |
Demographics Similar to Koreans by Professional Degree
In terms of professional degree, the demographic groups most similar to Koreans are Immigrants from Ghana (4.1%, a difference of 0.050%), Portuguese (4.1%, a difference of 0.10%), White/Caucasian (4.1%, a difference of 0.18%), German (4.1%, a difference of 0.36%), and Immigrants from Nigeria (4.1%, a difference of 0.39%).
| Demographics | Rating | Rank | Professional Degree |
| Yugoslavians | 13.4 /100 | #206 | Poor 4.1% |
| Sub-Saharan Africans | 12.8 /100 | #207 | Poor 4.1% |
| Immigrants | Somalia | 12.5 /100 | #208 | Poor 4.1% |
| Immigrants | Panama | 12.3 /100 | #209 | Poor 4.1% |
| Immigrants | Nigeria | 11.7 /100 | #210 | Poor 4.1% |
| Germans | 11.6 /100 | #211 | Poor 4.1% |
| Whites/Caucasians | 11.2 /100 | #212 | Poor 4.1% |
| Koreans | 10.7 /100 | #213 | Poor 4.1% |
| Immigrants | Ghana | 10.6 /100 | #214 | Poor 4.1% |
| Portuguese | 10.5 /100 | #215 | Poor 4.1% |
| West Indians | 9.8 /100 | #216 | Tragic 4.1% |
| Immigrants | Vietnam | 9.4 /100 | #217 | Tragic 4.0% |
| Dutch | 9.0 /100 | #218 | Tragic 4.0% |
| Immigrants | South Eastern Asia | 8.9 /100 | #219 | Tragic 4.0% |
| Ute | 8.2 /100 | #220 | Tragic 4.0% |