Guamanian/Chamorro vs Korean Professional Degree
COMPARE
Guamanian/Chamorro
Korean
Professional Degree
Professional Degree Comparison
Guamanians/Chamorros
Koreans
3.8%
PROFESSIONAL DEGREE
2.2/ 100
METRIC RATING
243rd/ 347
METRIC RANK
4.1%
PROFESSIONAL DEGREE
10.7/ 100
METRIC RATING
213th/ 347
METRIC RANK
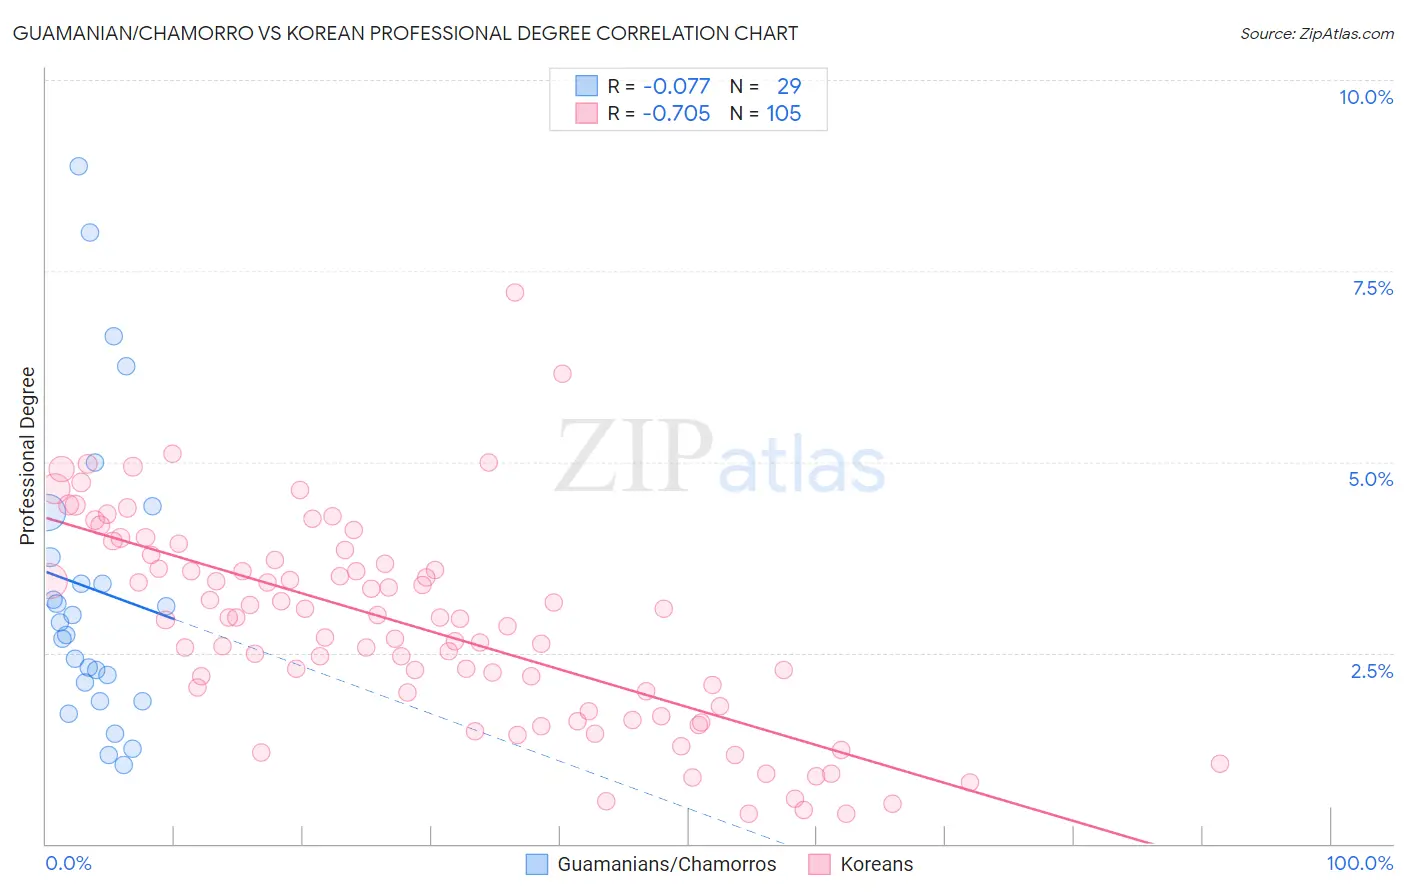
Guamanian/Chamorro vs Korean Professional Degree Correlation Chart
The statistical analysis conducted on geographies consisting of 221,637,971 people shows a slight negative correlation between the proportion of Guamanians/Chamorros and percentage of population with at least professional degree education in the United States with a correlation coefficient (R) of -0.077 and weighted average of 3.8%. Similarly, the statistical analysis conducted on geographies consisting of 508,138,227 people shows a strong negative correlation between the proportion of Koreans and percentage of population with at least professional degree education in the United States with a correlation coefficient (R) of -0.705 and weighted average of 4.1%, a difference of 7.0%.
Professional Degree Correlation Summary
| Measurement | Guamanian/Chamorro | Korean |
| Minimum | 1.0% | 0.39% |
| Maximum | 8.9% | 7.2% |
| Range | 7.8% | 6.8% |
| Mean | 3.3% | 2.8% |
| Median | 2.9% | 2.9% |
| Interquartile 25% (IQ1) | 2.0% | 1.8% |
| Interquartile 75% (IQ3) | 4.0% | 3.7% |
| Interquartile Range (IQR) | 2.1% | 1.9% |
| Standard Deviation (Sample) | 2.0% | 1.3% |
| Standard Deviation (Population) | 1.9% | 1.3% |
Similar Demographics by Professional Degree
Demographics Similar to Guamanians/Chamorros by Professional Degree
In terms of professional degree, the demographic groups most similar to Guamanians/Chamorros are Alaskan Athabascan (3.8%, a difference of 0.080%), Native Hawaiian (3.8%, a difference of 0.080%), Immigrants from Ecuador (3.8%, a difference of 0.10%), British West Indian (3.8%, a difference of 0.33%), and Immigrants from Bahamas (3.8%, a difference of 0.43%).
| Demographics | Rating | Rank | Professional Degree |
| Spanish Americans | 3.8 /100 | #236 | Tragic 3.9% |
| Immigrants | Trinidad and Tobago | 3.8 /100 | #237 | Tragic 3.9% |
| Colville | 2.6 /100 | #238 | Tragic 3.8% |
| British West Indians | 2.4 /100 | #239 | Tragic 3.8% |
| Immigrants | Ecuador | 2.3 /100 | #240 | Tragic 3.8% |
| Alaskan Athabascans | 2.3 /100 | #241 | Tragic 3.8% |
| Native Hawaiians | 2.3 /100 | #242 | Tragic 3.8% |
| Guamanians/Chamorros | 2.2 /100 | #243 | Tragic 3.8% |
| Immigrants | Bahamas | 2.0 /100 | #244 | Tragic 3.8% |
| French American Indians | 1.7 /100 | #245 | Tragic 3.8% |
| Marshallese | 1.7 /100 | #246 | Tragic 3.8% |
| Guyanese | 1.6 /100 | #247 | Tragic 3.8% |
| Hmong | 1.6 /100 | #248 | Tragic 3.7% |
| Immigrants | Grenada | 1.5 /100 | #249 | Tragic 3.7% |
| Immigrants | Fiji | 1.5 /100 | #250 | Tragic 3.7% |
Demographics Similar to Koreans by Professional Degree
In terms of professional degree, the demographic groups most similar to Koreans are Immigrants from Ghana (4.1%, a difference of 0.050%), Portuguese (4.1%, a difference of 0.10%), White/Caucasian (4.1%, a difference of 0.18%), German (4.1%, a difference of 0.36%), and Immigrants from Nigeria (4.1%, a difference of 0.39%).
| Demographics | Rating | Rank | Professional Degree |
| Yugoslavians | 13.4 /100 | #206 | Poor 4.1% |
| Sub-Saharan Africans | 12.8 /100 | #207 | Poor 4.1% |
| Immigrants | Somalia | 12.5 /100 | #208 | Poor 4.1% |
| Immigrants | Panama | 12.3 /100 | #209 | Poor 4.1% |
| Immigrants | Nigeria | 11.7 /100 | #210 | Poor 4.1% |
| Germans | 11.6 /100 | #211 | Poor 4.1% |
| Whites/Caucasians | 11.2 /100 | #212 | Poor 4.1% |
| Koreans | 10.7 /100 | #213 | Poor 4.1% |
| Immigrants | Ghana | 10.6 /100 | #214 | Poor 4.1% |
| Portuguese | 10.5 /100 | #215 | Poor 4.1% |
| West Indians | 9.8 /100 | #216 | Tragic 4.1% |
| Immigrants | Vietnam | 9.4 /100 | #217 | Tragic 4.0% |
| Dutch | 9.0 /100 | #218 | Tragic 4.0% |
| Immigrants | South Eastern Asia | 8.9 /100 | #219 | Tragic 4.0% |
| Ute | 8.2 /100 | #220 | Tragic 4.0% |