Norwegian vs Immigrants from Europe College, 1 year or more
COMPARE
Norwegian
Immigrants from Europe
College, 1 year or more
College, 1 year or more Comparison
Norwegians
Immigrants from Europe
61.7%
COLLEGE, 1 YEAR OR MORE
94.5/ 100
METRIC RATING
115th/ 347
METRIC RANK
63.3%
COLLEGE, 1 YEAR OR MORE
99.3/ 100
METRIC RATING
66th/ 347
METRIC RANK
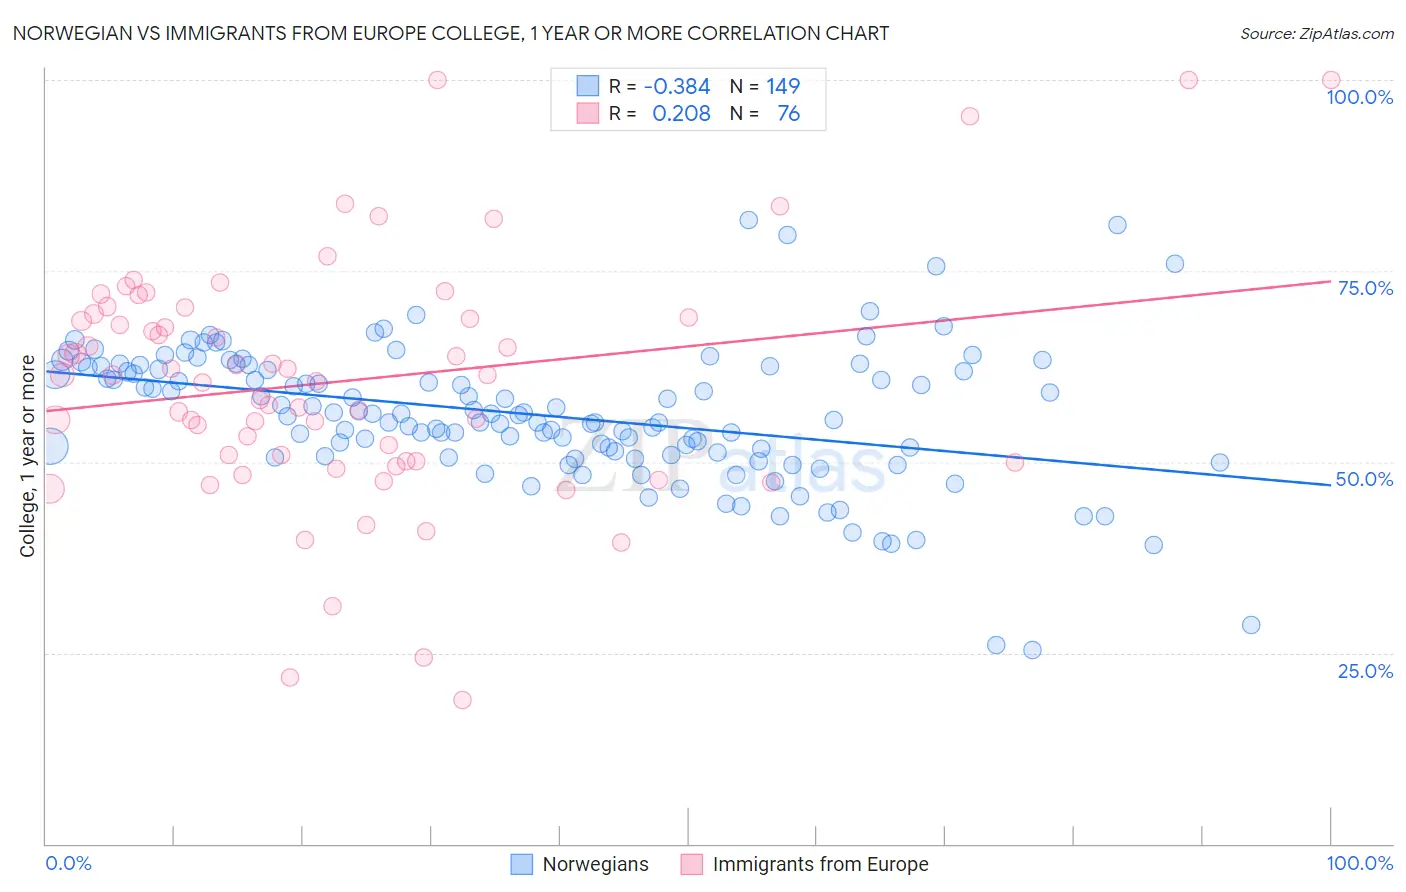
Norwegian vs Immigrants from Europe College, 1 year or more Correlation Chart
The statistical analysis conducted on geographies consisting of 533,389,627 people shows a mild negative correlation between the proportion of Norwegians and percentage of population with at least college, 1 year or more education in the United States with a correlation coefficient (R) of -0.384 and weighted average of 61.7%. Similarly, the statistical analysis conducted on geographies consisting of 547,418,471 people shows a weak positive correlation between the proportion of Immigrants from Europe and percentage of population with at least college, 1 year or more education in the United States with a correlation coefficient (R) of 0.208 and weighted average of 63.3%, a difference of 2.6%.
College, 1 year or more Correlation Summary
| Measurement | Norwegian | Immigrants from Europe |
| Minimum | 25.4% | 18.8% |
| Maximum | 81.7% | 100.0% |
| Range | 56.3% | 81.2% |
| Mean | 56.1% | 60.6% |
| Median | 56.3% | 61.4% |
| Interquartile 25% (IQ1) | 51.0% | 50.0% |
| Interquartile 75% (IQ3) | 62.5% | 69.1% |
| Interquartile Range (IQR) | 11.4% | 19.1% |
| Standard Deviation (Sample) | 9.1% | 16.1% |
| Standard Deviation (Population) | 9.1% | 15.9% |
Similar Demographics by College, 1 year or more
Demographics Similar to Norwegians by College, 1 year or more
In terms of college, 1 year or more, the demographic groups most similar to Norwegians are Danish (61.7%, a difference of 0.070%), Lebanese (61.6%, a difference of 0.10%), Arab (61.6%, a difference of 0.14%), Immigrants from Brazil (61.6%, a difference of 0.15%), and Ukrainian (61.8%, a difference of 0.18%).
| Demographics | Rating | Rank | College, 1 year or more |
| Syrians | 95.7 /100 | #108 | Exceptional 61.9% |
| Immigrants | Northern Africa | 95.7 /100 | #109 | Exceptional 61.9% |
| Europeans | 95.6 /100 | #110 | Exceptional 61.8% |
| Macedonians | 95.6 /100 | #111 | Exceptional 61.8% |
| Austrians | 95.4 /100 | #112 | Exceptional 61.8% |
| Ukrainians | 95.2 /100 | #113 | Exceptional 61.8% |
| Danes | 94.8 /100 | #114 | Exceptional 61.7% |
| Norwegians | 94.5 /100 | #115 | Exceptional 61.7% |
| Lebanese | 94.1 /100 | #116 | Exceptional 61.6% |
| Arabs | 93.9 /100 | #117 | Exceptional 61.6% |
| Immigrants | Brazil | 93.9 /100 | #118 | Exceptional 61.6% |
| Assyrians/Chaldeans/Syriacs | 93.3 /100 | #119 | Exceptional 61.5% |
| Pakistanis | 93.2 /100 | #120 | Exceptional 61.5% |
| Immigrants | Jordan | 92.7 /100 | #121 | Exceptional 61.4% |
| Immigrants | Chile | 92.3 /100 | #122 | Exceptional 61.4% |
Demographics Similar to Immigrants from Europe by College, 1 year or more
In terms of college, 1 year or more, the demographic groups most similar to Immigrants from Europe are Immigrants from Romania (63.3%, a difference of 0.020%), Immigrants from Greece (63.3%, a difference of 0.030%), Immigrants from Zimbabwe (63.3%, a difference of 0.040%), Maltese (63.4%, a difference of 0.10%), and Argentinean (63.2%, a difference of 0.13%).
| Demographics | Rating | Rank | College, 1 year or more |
| Immigrants | Serbia | 99.6 /100 | #59 | Exceptional 63.8% |
| Immigrants | Kazakhstan | 99.5 /100 | #60 | Exceptional 63.6% |
| Bolivians | 99.5 /100 | #61 | Exceptional 63.5% |
| Immigrants | Indonesia | 99.5 /100 | #62 | Exceptional 63.5% |
| Immigrants | Scotland | 99.4 /100 | #63 | Exceptional 63.4% |
| Immigrants | Spain | 99.4 /100 | #64 | Exceptional 63.4% |
| Maltese | 99.3 /100 | #65 | Exceptional 63.4% |
| Immigrants | Europe | 99.3 /100 | #66 | Exceptional 63.3% |
| Immigrants | Romania | 99.3 /100 | #67 | Exceptional 63.3% |
| Immigrants | Greece | 99.3 /100 | #68 | Exceptional 63.3% |
| Immigrants | Zimbabwe | 99.3 /100 | #69 | Exceptional 63.3% |
| Argentineans | 99.2 /100 | #70 | Exceptional 63.2% |
| Immigrants | Canada | 99.1 /100 | #71 | Exceptional 63.1% |
| Egyptians | 99.0 /100 | #72 | Exceptional 63.1% |
| Immigrants | Moldova | 99.0 /100 | #73 | Exceptional 63.0% |