Chippewa vs Immigrants from Czechoslovakia 5th Grade
COMPARE
Chippewa
Immigrants from Czechoslovakia
5th Grade
5th Grade Comparison
Chippewa
Immigrants from Czechoslovakia
98.1%
5TH GRADE
100.0/ 100
METRIC RATING
32nd/ 347
METRIC RANK
97.7%
5TH GRADE
97.5/ 100
METRIC RATING
106th/ 347
METRIC RANK
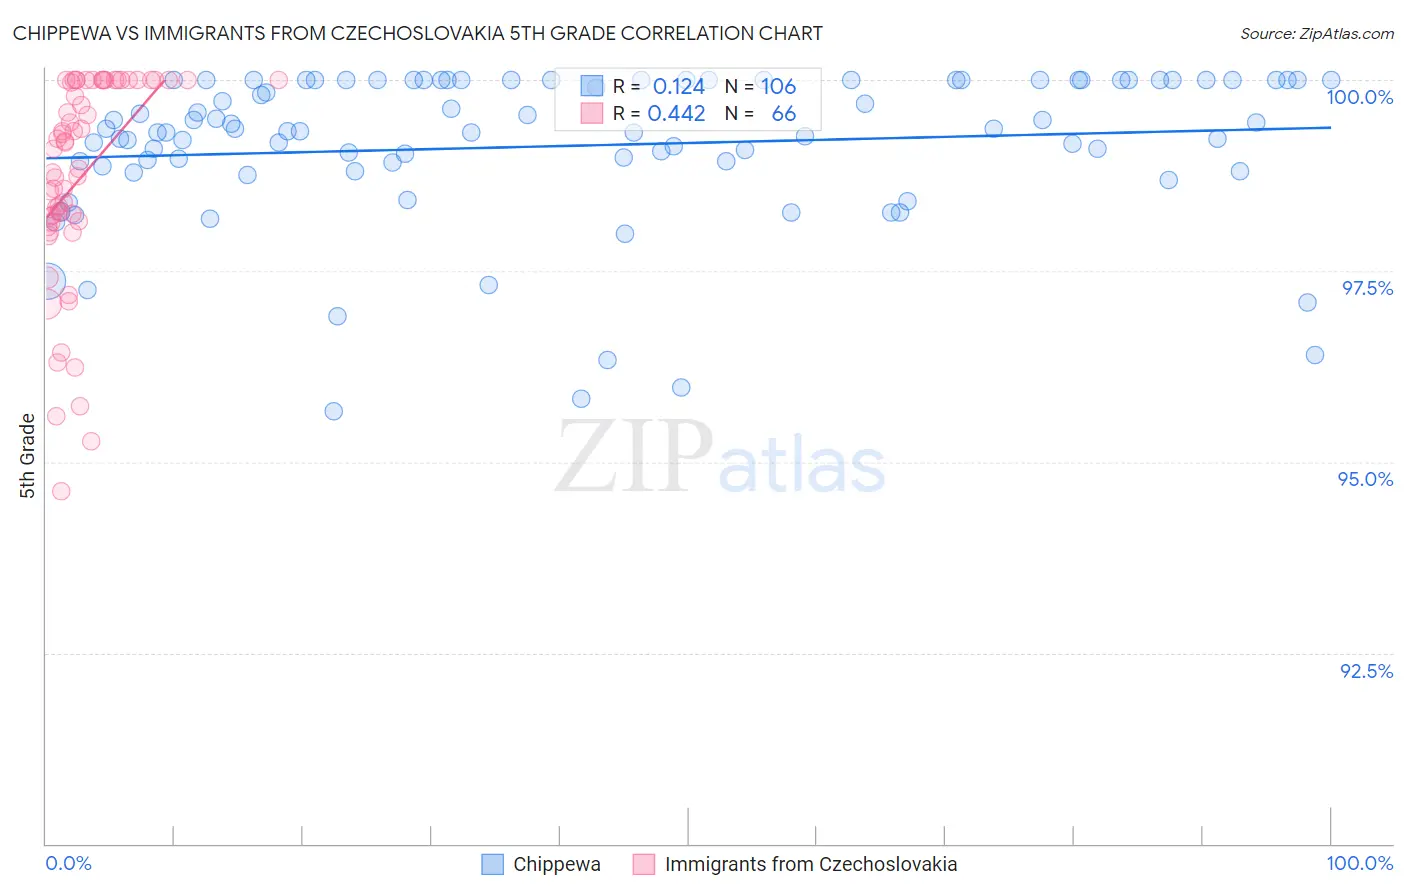
Chippewa vs Immigrants from Czechoslovakia 5th Grade Correlation Chart
The statistical analysis conducted on geographies consisting of 215,065,644 people shows a poor positive correlation between the proportion of Chippewa and percentage of population with at least 5th grade education in the United States with a correlation coefficient (R) of 0.124 and weighted average of 98.1%. Similarly, the statistical analysis conducted on geographies consisting of 195,448,060 people shows a moderate positive correlation between the proportion of Immigrants from Czechoslovakia and percentage of population with at least 5th grade education in the United States with a correlation coefficient (R) of 0.442 and weighted average of 97.7%, a difference of 0.44%.
5th Grade Correlation Summary
| Measurement | Chippewa | Immigrants from Czechoslovakia |
| Minimum | 95.7% | 94.6% |
| Maximum | 100.0% | 100.0% |
| Range | 4.3% | 5.4% |
| Mean | 99.1% | 98.7% |
| Median | 99.3% | 99.1% |
| Interquartile 25% (IQ1) | 98.9% | 98.2% |
| Interquartile 75% (IQ3) | 100.0% | 100.0% |
| Interquartile Range (IQR) | 1.1% | 1.8% |
| Standard Deviation (Sample) | 1.0% | 1.4% |
| Standard Deviation (Population) | 1.0% | 1.3% |
Similar Demographics by 5th Grade
Demographics Similar to Chippewa by 5th Grade
In terms of 5th grade, the demographic groups most similar to Chippewa are Swiss (98.1%, a difference of 0.010%), Chinese (98.1%, a difference of 0.010%), Italian (98.1%, a difference of 0.020%), British (98.1%, a difference of 0.030%), and European (98.2%, a difference of 0.040%).
| Demographics | Rating | Rank | 5th Grade |
| Yup'ik | 100.0 /100 | #25 | Exceptional 98.2% |
| Alaska Natives | 100.0 /100 | #26 | Exceptional 98.2% |
| French | 100.0 /100 | #27 | Exceptional 98.2% |
| Czechs | 100.0 /100 | #28 | Exceptional 98.2% |
| Scandinavians | 100.0 /100 | #29 | Exceptional 98.2% |
| French Canadians | 100.0 /100 | #30 | Exceptional 98.2% |
| Europeans | 100.0 /100 | #31 | Exceptional 98.2% |
| Chippewa | 100.0 /100 | #32 | Exceptional 98.1% |
| Swiss | 100.0 /100 | #33 | Exceptional 98.1% |
| Chinese | 100.0 /100 | #34 | Exceptional 98.1% |
| Italians | 100.0 /100 | #35 | Exceptional 98.1% |
| British | 100.0 /100 | #36 | Exceptional 98.1% |
| Latvians | 99.9 /100 | #37 | Exceptional 98.1% |
| Belgians | 99.9 /100 | #38 | Exceptional 98.1% |
| Luxembourgers | 99.9 /100 | #39 | Exceptional 98.1% |
Demographics Similar to Immigrants from Czechoslovakia by 5th Grade
In terms of 5th grade, the demographic groups most similar to Immigrants from Czechoslovakia are Bhutanese (97.7%, a difference of 0.0%), Immigrants from Singapore (97.7%, a difference of 0.0%), German Russian (97.7%, a difference of 0.010%), Nonimmigrants (97.7%, a difference of 0.010%), and Choctaw (97.7%, a difference of 0.020%).
| Demographics | Rating | Rank | 5th Grade |
| Turks | 98.3 /100 | #99 | Exceptional 97.7% |
| Puget Sound Salish | 98.3 /100 | #100 | Exceptional 97.7% |
| South Africans | 98.3 /100 | #101 | Exceptional 97.7% |
| Choctaw | 98.0 /100 | #102 | Exceptional 97.7% |
| Cheyenne | 97.9 /100 | #103 | Exceptional 97.7% |
| German Russians | 97.8 /100 | #104 | Exceptional 97.7% |
| Bhutanese | 97.6 /100 | #105 | Exceptional 97.7% |
| Immigrants | Czechoslovakia | 97.5 /100 | #106 | Exceptional 97.7% |
| Immigrants | Singapore | 97.5 /100 | #107 | Exceptional 97.7% |
| Immigrants | Nonimmigrants | 97.3 /100 | #108 | Exceptional 97.7% |
| Immigrants | Latvia | 97.1 /100 | #109 | Exceptional 97.7% |
| Thais | 96.9 /100 | #110 | Exceptional 97.7% |
| Menominee | 96.3 /100 | #111 | Exceptional 97.7% |
| Immigrants | Switzerland | 96.0 /100 | #112 | Exceptional 97.7% |
| Iroquois | 95.9 /100 | #113 | Exceptional 97.7% |