Chippewa vs Creek 5th Grade
COMPARE
Chippewa
Creek
5th Grade
5th Grade Comparison
Chippewa
Creek
98.1%
5TH GRADE
100.0/ 100
METRIC RATING
32nd/ 347
METRIC RANK
98.0%
5TH GRADE
99.8/ 100
METRIC RATING
55th/ 347
METRIC RANK
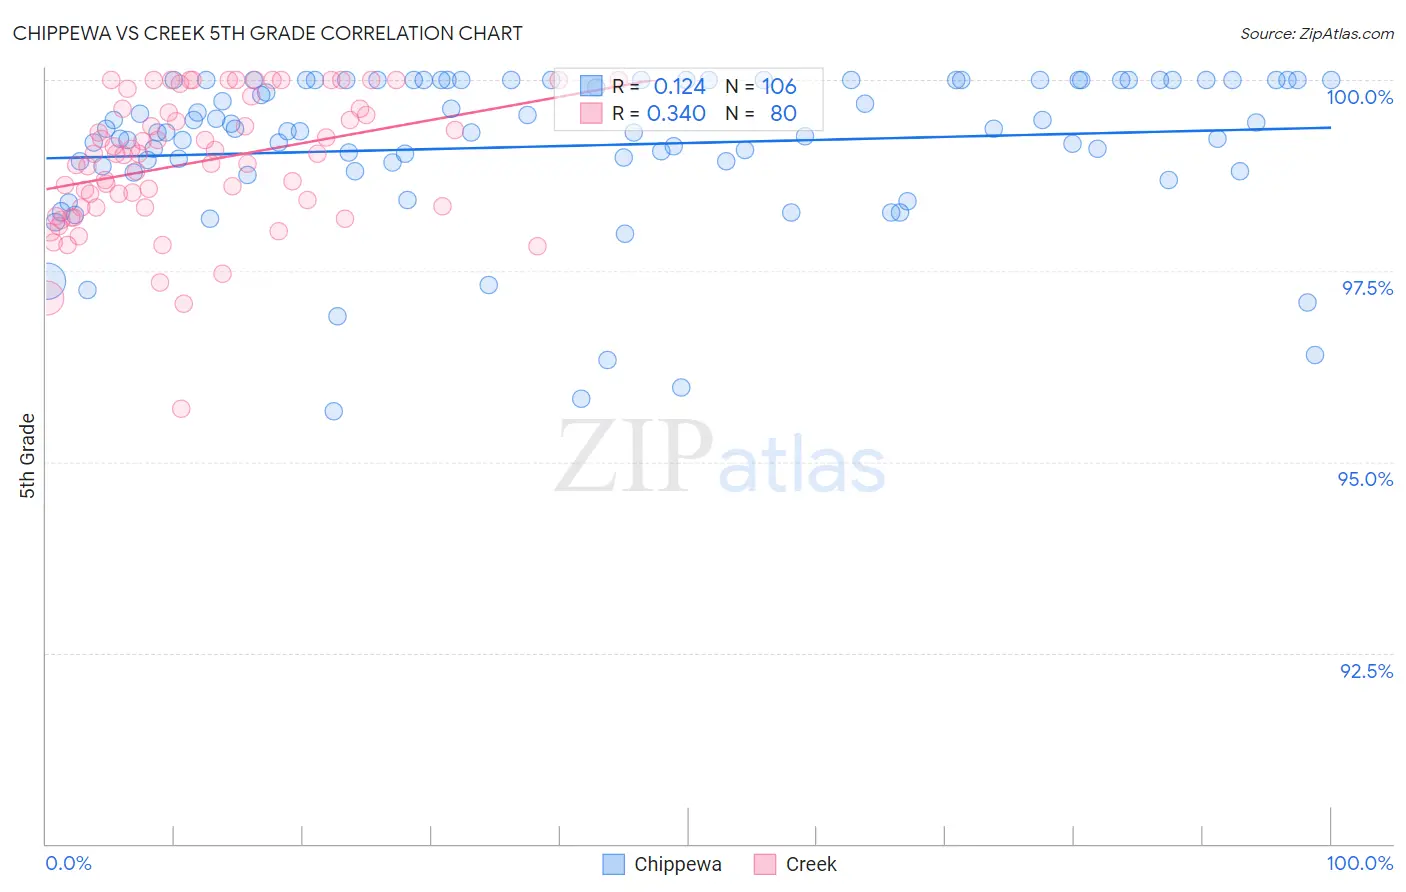
Chippewa vs Creek 5th Grade Correlation Chart
The statistical analysis conducted on geographies consisting of 215,065,644 people shows a poor positive correlation between the proportion of Chippewa and percentage of population with at least 5th grade education in the United States with a correlation coefficient (R) of 0.124 and weighted average of 98.1%. Similarly, the statistical analysis conducted on geographies consisting of 178,480,663 people shows a mild positive correlation between the proportion of Creek and percentage of population with at least 5th grade education in the United States with a correlation coefficient (R) of 0.340 and weighted average of 98.0%, a difference of 0.18%.
5th Grade Correlation Summary
| Measurement | Chippewa | Creek |
| Minimum | 95.7% | 95.7% |
| Maximum | 100.0% | 100.0% |
| Range | 4.3% | 4.3% |
| Mean | 99.1% | 98.9% |
| Median | 99.3% | 99.0% |
| Interquartile 25% (IQ1) | 98.9% | 98.3% |
| Interquartile 75% (IQ3) | 100.0% | 99.6% |
| Interquartile Range (IQR) | 1.1% | 1.3% |
| Standard Deviation (Sample) | 1.0% | 0.87% |
| Standard Deviation (Population) | 1.0% | 0.87% |
Similar Demographics by 5th Grade
Demographics Similar to Chippewa by 5th Grade
In terms of 5th grade, the demographic groups most similar to Chippewa are Swiss (98.1%, a difference of 0.010%), Chinese (98.1%, a difference of 0.010%), Italian (98.1%, a difference of 0.020%), British (98.1%, a difference of 0.030%), and European (98.2%, a difference of 0.040%).
| Demographics | Rating | Rank | 5th Grade |
| Yup'ik | 100.0 /100 | #25 | Exceptional 98.2% |
| Alaska Natives | 100.0 /100 | #26 | Exceptional 98.2% |
| French | 100.0 /100 | #27 | Exceptional 98.2% |
| Czechs | 100.0 /100 | #28 | Exceptional 98.2% |
| Scandinavians | 100.0 /100 | #29 | Exceptional 98.2% |
| French Canadians | 100.0 /100 | #30 | Exceptional 98.2% |
| Europeans | 100.0 /100 | #31 | Exceptional 98.2% |
| Chippewa | 100.0 /100 | #32 | Exceptional 98.1% |
| Swiss | 100.0 /100 | #33 | Exceptional 98.1% |
| Chinese | 100.0 /100 | #34 | Exceptional 98.1% |
| Italians | 100.0 /100 | #35 | Exceptional 98.1% |
| British | 100.0 /100 | #36 | Exceptional 98.1% |
| Latvians | 99.9 /100 | #37 | Exceptional 98.1% |
| Belgians | 99.9 /100 | #38 | Exceptional 98.1% |
| Luxembourgers | 99.9 /100 | #39 | Exceptional 98.1% |
Demographics Similar to Creek by 5th Grade
In terms of 5th grade, the demographic groups most similar to Creek are Greek (97.9%, a difference of 0.0%), Austrian (97.9%, a difference of 0.0%), Slavic (98.0%, a difference of 0.010%), Australian (98.0%, a difference of 0.010%), and White/Caucasian (97.9%, a difference of 0.010%).
| Demographics | Rating | Rank | 5th Grade |
| Bulgarians | 99.8 /100 | #48 | Exceptional 98.0% |
| Estonians | 99.8 /100 | #49 | Exceptional 98.0% |
| Immigrants | Scotland | 99.8 /100 | #50 | Exceptional 98.0% |
| Celtics | 99.8 /100 | #51 | Exceptional 98.0% |
| Maltese | 99.8 /100 | #52 | Exceptional 98.0% |
| Slavs | 99.8 /100 | #53 | Exceptional 98.0% |
| Australians | 99.8 /100 | #54 | Exceptional 98.0% |
| Creek | 99.8 /100 | #55 | Exceptional 98.0% |
| Greeks | 99.8 /100 | #56 | Exceptional 97.9% |
| Austrians | 99.8 /100 | #57 | Exceptional 97.9% |
| Whites/Caucasians | 99.8 /100 | #58 | Exceptional 97.9% |
| Americans | 99.7 /100 | #59 | Exceptional 97.9% |
| Immigrants | Canada | 99.7 /100 | #60 | Exceptional 97.9% |
| Serbians | 99.7 /100 | #61 | Exceptional 97.9% |
| Immigrants | North America | 99.7 /100 | #62 | Exceptional 97.9% |