Chippewa vs Immigrants from Dominica 5th Grade
COMPARE
Chippewa
Immigrants from Dominica
5th Grade
5th Grade Comparison
Chippewa
Immigrants from Dominica
98.1%
5TH GRADE
100.0/ 100
METRIC RATING
32nd/ 347
METRIC RANK
96.2%
5TH GRADE
0.0/ 100
METRIC RATING
298th/ 347
METRIC RANK
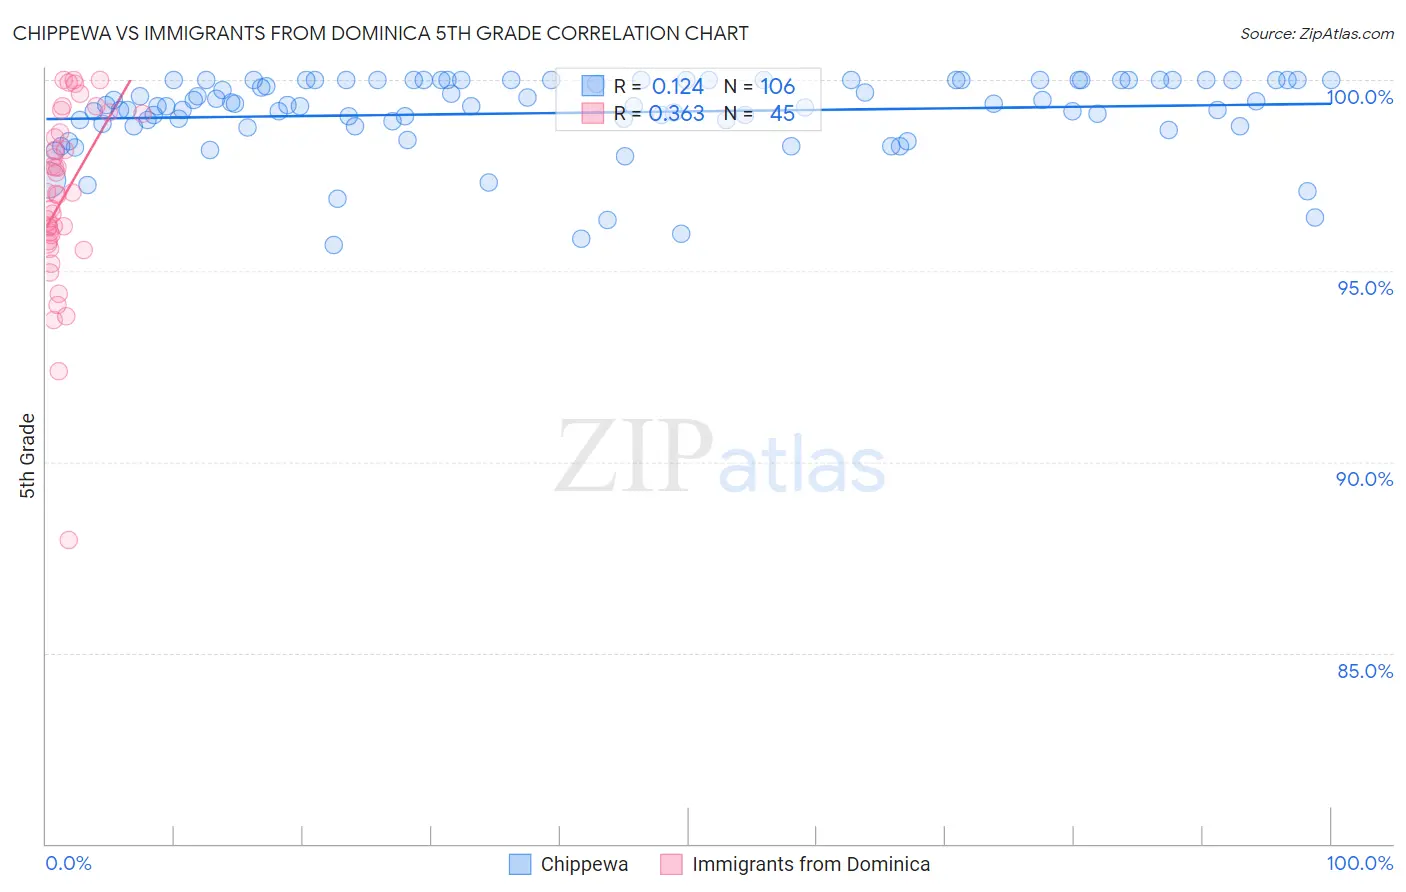
Chippewa vs Immigrants from Dominica 5th Grade Correlation Chart
The statistical analysis conducted on geographies consisting of 215,065,644 people shows a poor positive correlation between the proportion of Chippewa and percentage of population with at least 5th grade education in the United States with a correlation coefficient (R) of 0.124 and weighted average of 98.1%. Similarly, the statistical analysis conducted on geographies consisting of 83,794,115 people shows a mild positive correlation between the proportion of Immigrants from Dominica and percentage of population with at least 5th grade education in the United States with a correlation coefficient (R) of 0.363 and weighted average of 96.2%, a difference of 2.0%.
5th Grade Correlation Summary
| Measurement | Chippewa | Immigrants from Dominica |
| Minimum | 95.7% | 88.0% |
| Maximum | 100.0% | 100.0% |
| Range | 4.3% | 12.0% |
| Mean | 99.1% | 96.9% |
| Median | 99.3% | 97.0% |
| Interquartile 25% (IQ1) | 98.9% | 95.8% |
| Interquartile 75% (IQ3) | 100.0% | 98.9% |
| Interquartile Range (IQR) | 1.1% | 3.1% |
| Standard Deviation (Sample) | 1.0% | 2.4% |
| Standard Deviation (Population) | 1.0% | 2.3% |
Similar Demographics by 5th Grade
Demographics Similar to Chippewa by 5th Grade
In terms of 5th grade, the demographic groups most similar to Chippewa are Swiss (98.1%, a difference of 0.010%), Chinese (98.1%, a difference of 0.010%), Italian (98.1%, a difference of 0.020%), British (98.1%, a difference of 0.030%), and European (98.2%, a difference of 0.040%).
| Demographics | Rating | Rank | 5th Grade |
| Yup'ik | 100.0 /100 | #25 | Exceptional 98.2% |
| Alaska Natives | 100.0 /100 | #26 | Exceptional 98.2% |
| French | 100.0 /100 | #27 | Exceptional 98.2% |
| Czechs | 100.0 /100 | #28 | Exceptional 98.2% |
| Scandinavians | 100.0 /100 | #29 | Exceptional 98.2% |
| French Canadians | 100.0 /100 | #30 | Exceptional 98.2% |
| Europeans | 100.0 /100 | #31 | Exceptional 98.2% |
| Chippewa | 100.0 /100 | #32 | Exceptional 98.1% |
| Swiss | 100.0 /100 | #33 | Exceptional 98.1% |
| Chinese | 100.0 /100 | #34 | Exceptional 98.1% |
| Italians | 100.0 /100 | #35 | Exceptional 98.1% |
| British | 100.0 /100 | #36 | Exceptional 98.1% |
| Latvians | 99.9 /100 | #37 | Exceptional 98.1% |
| Belgians | 99.9 /100 | #38 | Exceptional 98.1% |
| Luxembourgers | 99.9 /100 | #39 | Exceptional 98.1% |
Demographics Similar to Immigrants from Dominica by 5th Grade
In terms of 5th grade, the demographic groups most similar to Immigrants from Dominica are Immigrants (96.2%, a difference of 0.030%), Haitian (96.3%, a difference of 0.050%), Immigrants from South Eastern Asia (96.3%, a difference of 0.080%), Sri Lankan (96.1%, a difference of 0.080%), and Immigrants from Cuba (96.1%, a difference of 0.10%).
| Demographics | Rating | Rank | 5th Grade |
| Malaysians | 0.0 /100 | #291 | Tragic 96.5% |
| Somalis | 0.0 /100 | #292 | Tragic 96.5% |
| Immigrants | Grenada | 0.0 /100 | #293 | Tragic 96.5% |
| Immigrants | Eritrea | 0.0 /100 | #294 | Tragic 96.4% |
| Immigrants | Somalia | 0.0 /100 | #295 | Tragic 96.4% |
| Immigrants | South Eastern Asia | 0.0 /100 | #296 | Tragic 96.3% |
| Haitians | 0.0 /100 | #297 | Tragic 96.3% |
| Immigrants | Dominica | 0.0 /100 | #298 | Tragic 96.2% |
| Immigrants | Immigrants | 0.0 /100 | #299 | Tragic 96.2% |
| Sri Lankans | 0.0 /100 | #300 | Tragic 96.1% |
| Immigrants | Cuba | 0.0 /100 | #301 | Tragic 96.1% |
| Guyanese | 0.0 /100 | #302 | Tragic 96.1% |
| Puerto Ricans | 0.0 /100 | #303 | Tragic 96.1% |
| Immigrants | Burma/Myanmar | 0.0 /100 | #304 | Tragic 96.1% |
| Immigrants | Laos | 0.0 /100 | #305 | Tragic 96.0% |