Chippewa vs Immigrants from Czechoslovakia Vision Disability
COMPARE
Chippewa
Immigrants from Czechoslovakia
Vision Disability
Vision Disability Comparison
Chippewa
Immigrants from Czechoslovakia
2.4%
VISION DISABILITY
0.0/ 100
METRIC RATING
275th/ 347
METRIC RANK
2.0%
VISION DISABILITY
98.7/ 100
METRIC RATING
68th/ 347
METRIC RANK
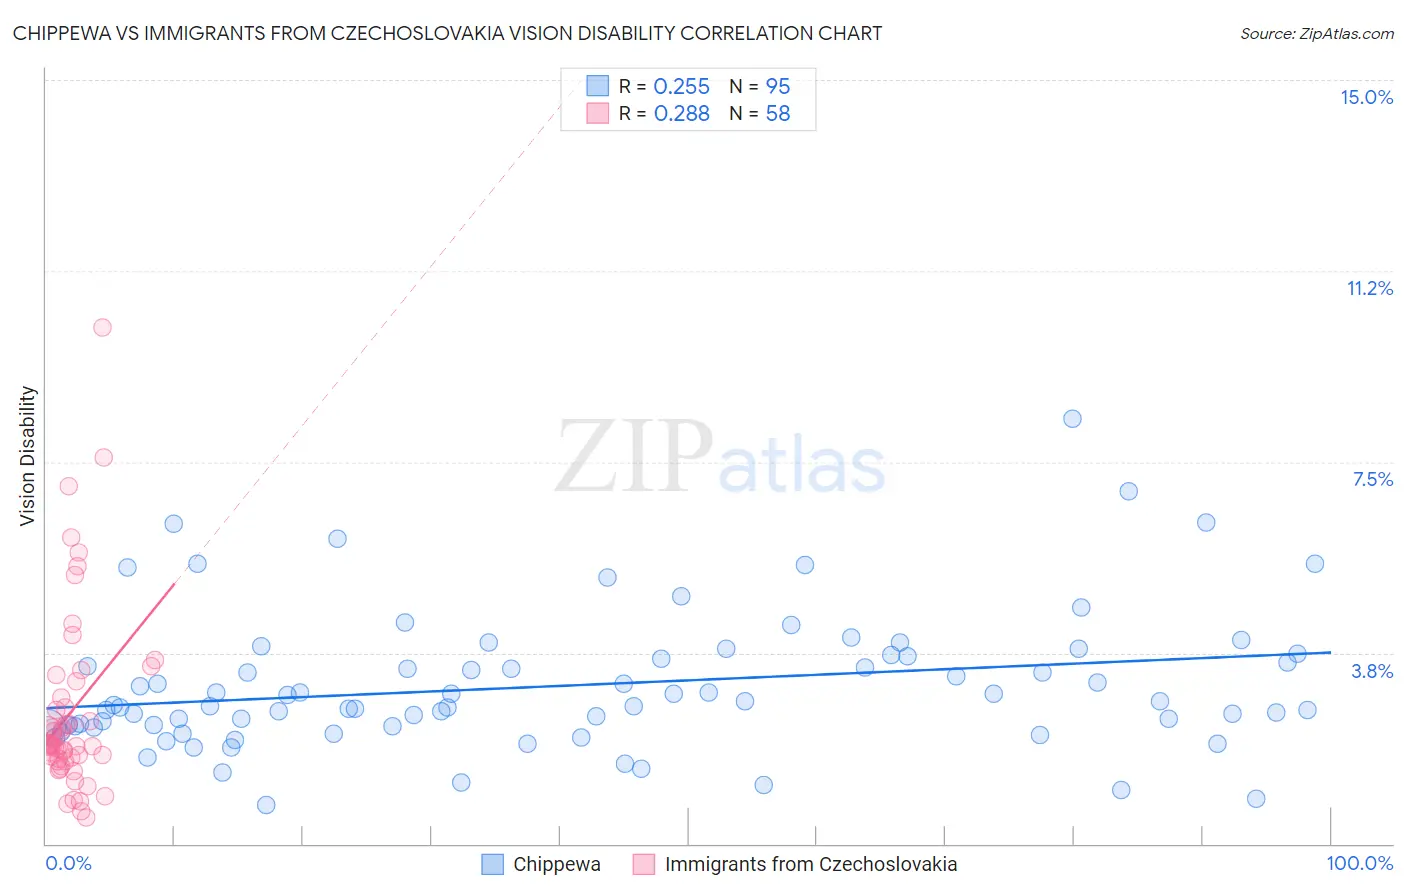
Chippewa vs Immigrants from Czechoslovakia Vision Disability Correlation Chart
The statistical analysis conducted on geographies consisting of 214,949,512 people shows a weak positive correlation between the proportion of Chippewa and percentage of population with vision disability in the United States with a correlation coefficient (R) of 0.255 and weighted average of 2.4%. Similarly, the statistical analysis conducted on geographies consisting of 195,413,823 people shows a weak positive correlation between the proportion of Immigrants from Czechoslovakia and percentage of population with vision disability in the United States with a correlation coefficient (R) of 0.288 and weighted average of 2.0%, a difference of 20.8%.
Vision Disability Correlation Summary
| Measurement | Chippewa | Immigrants from Czechoslovakia |
| Minimum | 0.77% | 0.52% |
| Maximum | 8.4% | 10.1% |
| Range | 7.6% | 9.6% |
| Mean | 3.1% | 2.6% |
| Median | 2.7% | 1.9% |
| Interquartile 25% (IQ1) | 2.3% | 1.7% |
| Interquartile 75% (IQ3) | 3.7% | 2.9% |
| Interquartile Range (IQR) | 1.4% | 1.2% |
| Standard Deviation (Sample) | 1.3% | 1.8% |
| Standard Deviation (Population) | 1.3% | 1.8% |
Similar Demographics by Vision Disability
Demographics Similar to Chippewa by Vision Disability
In terms of vision disability, the demographic groups most similar to Chippewa are Scotch-Irish (2.4%, a difference of 0.090%), Bahamian (2.4%, a difference of 0.13%), Spanish (2.4%, a difference of 0.29%), Nepalese (2.4%, a difference of 0.30%), and Immigrants from Latin America (2.4%, a difference of 0.32%).
| Demographics | Rating | Rank | Vision Disability |
| Senegalese | 0.1 /100 | #268 | Tragic 2.4% |
| Celtics | 0.1 /100 | #269 | Tragic 2.4% |
| Cubans | 0.1 /100 | #270 | Tragic 2.4% |
| Immigrants | Azores | 0.1 /100 | #271 | Tragic 2.4% |
| Spaniards | 0.1 /100 | #272 | Tragic 2.4% |
| Immigrants | Bahamas | 0.1 /100 | #273 | Tragic 2.4% |
| Immigrants | Latin America | 0.0 /100 | #274 | Tragic 2.4% |
| Chippewa | 0.0 /100 | #275 | Tragic 2.4% |
| Scotch-Irish | 0.0 /100 | #276 | Tragic 2.4% |
| Bahamians | 0.0 /100 | #277 | Tragic 2.4% |
| Spanish | 0.0 /100 | #278 | Tragic 2.4% |
| Nepalese | 0.0 /100 | #279 | Tragic 2.4% |
| Cape Verdeans | 0.0 /100 | #280 | Tragic 2.4% |
| U.S. Virgin Islanders | 0.0 /100 | #281 | Tragic 2.5% |
| Immigrants | Caribbean | 0.0 /100 | #282 | Tragic 2.5% |
Demographics Similar to Immigrants from Czechoslovakia by Vision Disability
In terms of vision disability, the demographic groups most similar to Immigrants from Czechoslovakia are Immigrants from Northern Africa (2.0%, a difference of 0.10%), Russian (2.0%, a difference of 0.17%), Immigrants from Kazakhstan (2.0%, a difference of 0.19%), Immigrants from Northern Europe (2.0%, a difference of 0.20%), and Immigrants from Argentina (2.0%, a difference of 0.21%).
| Demographics | Rating | Rank | Vision Disability |
| Immigrants | Belgium | 99.1 /100 | #61 | Exceptional 2.0% |
| Immigrants | Russia | 99.1 /100 | #62 | Exceptional 2.0% |
| Armenians | 99.0 /100 | #63 | Exceptional 2.0% |
| Immigrants | Greece | 99.0 /100 | #64 | Exceptional 2.0% |
| Maltese | 98.9 /100 | #65 | Exceptional 2.0% |
| Immigrants | Argentina | 98.9 /100 | #66 | Exceptional 2.0% |
| Immigrants | Northern Africa | 98.8 /100 | #67 | Exceptional 2.0% |
| Immigrants | Czechoslovakia | 98.7 /100 | #68 | Exceptional 2.0% |
| Russians | 98.6 /100 | #69 | Exceptional 2.0% |
| Immigrants | Kazakhstan | 98.6 /100 | #70 | Exceptional 2.0% |
| Immigrants | Northern Europe | 98.6 /100 | #71 | Exceptional 2.0% |
| Immigrants | France | 98.5 /100 | #72 | Exceptional 2.0% |
| Immigrants | Eritrea | 98.4 /100 | #73 | Exceptional 2.0% |
| Palestinians | 98.3 /100 | #74 | Exceptional 2.0% |
| Immigrants | North Macedonia | 98.3 /100 | #75 | Exceptional 2.0% |