Chippewa vs Immigrants from Czechoslovakia Male Poverty
COMPARE
Chippewa
Immigrants from Czechoslovakia
Male Poverty
Male Poverty Comparison
Chippewa
Immigrants from Czechoslovakia
14.6%
MALE POVERTY
0.0/ 100
METRIC RATING
315th/ 347
METRIC RANK
10.0%
MALE POVERTY
98.6/ 100
METRIC RATING
53rd/ 347
METRIC RANK
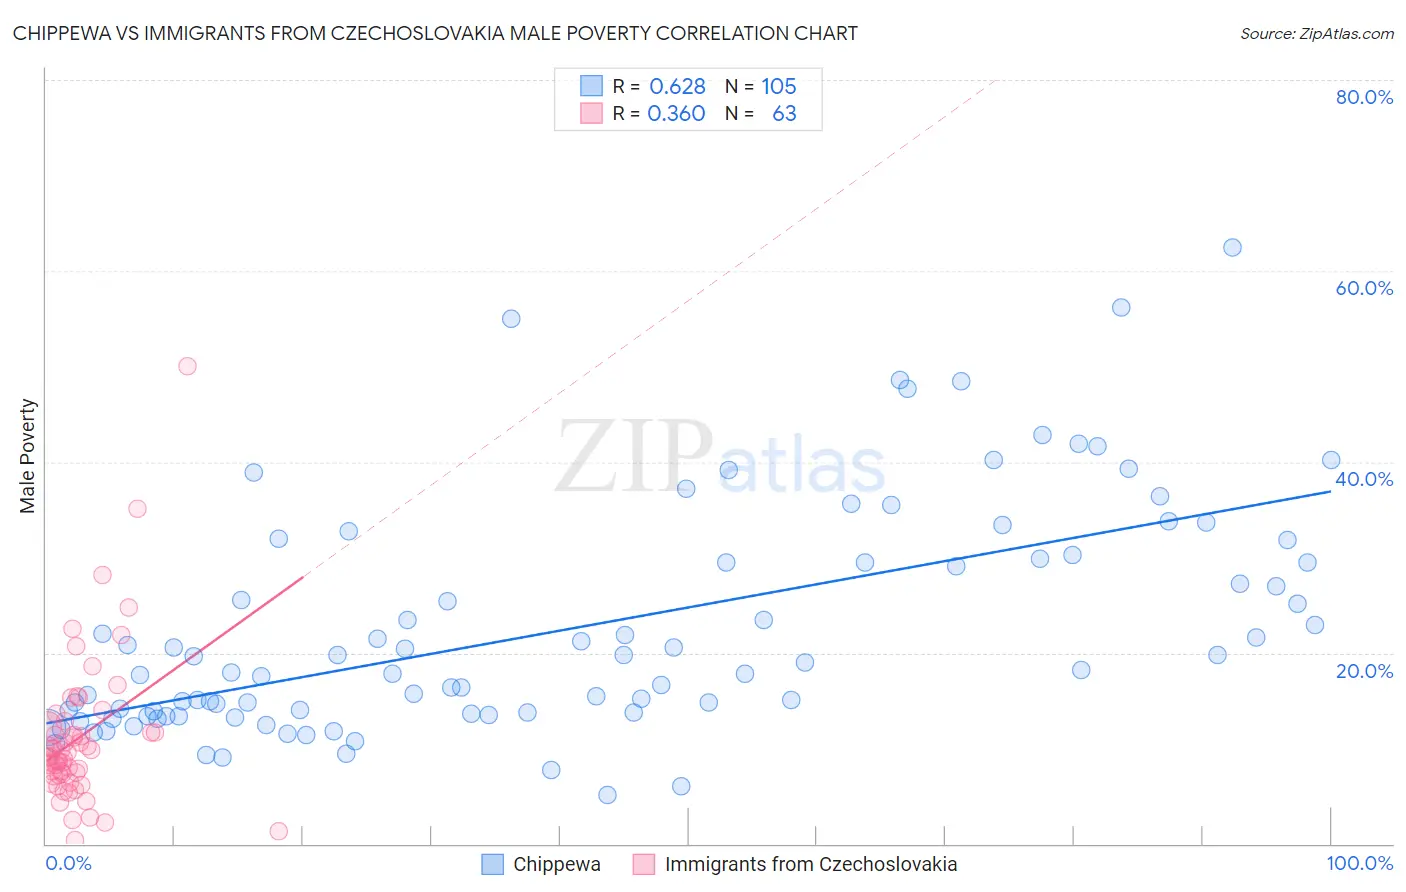
Chippewa vs Immigrants from Czechoslovakia Male Poverty Correlation Chart
The statistical analysis conducted on geographies consisting of 214,985,801 people shows a significant positive correlation between the proportion of Chippewa and poverty level among males in the United States with a correlation coefficient (R) of 0.628 and weighted average of 14.6%. Similarly, the statistical analysis conducted on geographies consisting of 195,424,226 people shows a mild positive correlation between the proportion of Immigrants from Czechoslovakia and poverty level among males in the United States with a correlation coefficient (R) of 0.360 and weighted average of 10.0%, a difference of 45.7%.
Male Poverty Correlation Summary
| Measurement | Chippewa | Immigrants from Czechoslovakia |
| Minimum | 5.1% | 0.44% |
| Maximum | 62.5% | 50.0% |
| Range | 57.4% | 49.6% |
| Mean | 22.5% | 11.2% |
| Median | 18.2% | 9.2% |
| Interquartile 25% (IQ1) | 13.6% | 7.2% |
| Interquartile 75% (IQ3) | 29.7% | 12.2% |
| Interquartile Range (IQR) | 16.0% | 5.0% |
| Standard Deviation (Sample) | 12.0% | 8.0% |
| Standard Deviation (Population) | 11.9% | 7.9% |
Similar Demographics by Male Poverty
Demographics Similar to Chippewa by Male Poverty
In terms of male poverty, the demographic groups most similar to Chippewa are British West Indian (14.6%, a difference of 0.020%), Immigrants from Honduras (14.6%, a difference of 0.080%), Immigrants from Somalia (14.6%, a difference of 0.11%), Immigrants from Dominica (14.7%, a difference of 0.70%), and Immigrants from Grenada (14.7%, a difference of 0.76%).
| Demographics | Rating | Rank | Male Poverty |
| Africans | 0.0 /100 | #308 | Tragic 14.2% |
| Somalis | 0.0 /100 | #309 | Tragic 14.3% |
| Seminole | 0.0 /100 | #310 | Tragic 14.3% |
| Hondurans | 0.0 /100 | #311 | Tragic 14.3% |
| Choctaw | 0.0 /100 | #312 | Tragic 14.4% |
| Immigrants | Somalia | 0.0 /100 | #313 | Tragic 14.6% |
| Immigrants | Honduras | 0.0 /100 | #314 | Tragic 14.6% |
| Chippewa | 0.0 /100 | #315 | Tragic 14.6% |
| British West Indians | 0.0 /100 | #316 | Tragic 14.6% |
| Immigrants | Dominica | 0.0 /100 | #317 | Tragic 14.7% |
| Immigrants | Grenada | 0.0 /100 | #318 | Tragic 14.7% |
| U.S. Virgin Islanders | 0.0 /100 | #319 | Tragic 14.7% |
| Immigrants | Congo | 0.0 /100 | #320 | Tragic 14.7% |
| Arapaho | 0.0 /100 | #321 | Tragic 15.1% |
| Kiowa | 0.0 /100 | #322 | Tragic 15.2% |
Demographics Similar to Immigrants from Czechoslovakia by Male Poverty
In terms of male poverty, the demographic groups most similar to Immigrants from Czechoslovakia are Asian (10.0%, a difference of 0.070%), Immigrants from Croatia (10.0%, a difference of 0.16%), Immigrants from Philippines (10.0%, a difference of 0.27%), Immigrants from Austria (10.0%, a difference of 0.28%), and Slovene (10.0%, a difference of 0.32%).
| Demographics | Rating | Rank | Male Poverty |
| Turks | 98.9 /100 | #46 | Exceptional 10.0% |
| Immigrants | Singapore | 98.8 /100 | #47 | Exceptional 10.0% |
| Immigrants | Japan | 98.8 /100 | #48 | Exceptional 10.0% |
| Slovenes | 98.8 /100 | #49 | Exceptional 10.0% |
| Immigrants | Philippines | 98.7 /100 | #50 | Exceptional 10.0% |
| Immigrants | Croatia | 98.7 /100 | #51 | Exceptional 10.0% |
| Asians | 98.7 /100 | #52 | Exceptional 10.0% |
| Immigrants | Czechoslovakia | 98.6 /100 | #53 | Exceptional 10.0% |
| Immigrants | Austria | 98.5 /100 | #54 | Exceptional 10.0% |
| Germans | 98.3 /100 | #55 | Exceptional 10.1% |
| Immigrants | Bulgaria | 98.2 /100 | #56 | Exceptional 10.1% |
| Estonians | 98.1 /100 | #57 | Exceptional 10.1% |
| Scandinavians | 98.0 /100 | #58 | Exceptional 10.1% |
| Immigrants | Europe | 97.9 /100 | #59 | Exceptional 10.1% |
| Ukrainians | 97.9 /100 | #60 | Exceptional 10.1% |