Hawaiian vs Immigrants from Czechoslovakia 5th Grade
COMPARE
Hawaiian
Immigrants from Czechoslovakia
5th Grade
5th Grade Comparison
Hawaiians
Immigrants from Czechoslovakia
97.2%
5TH GRADE
25.6/ 100
METRIC RATING
196th/ 347
METRIC RANK
97.7%
5TH GRADE
97.5/ 100
METRIC RATING
106th/ 347
METRIC RANK
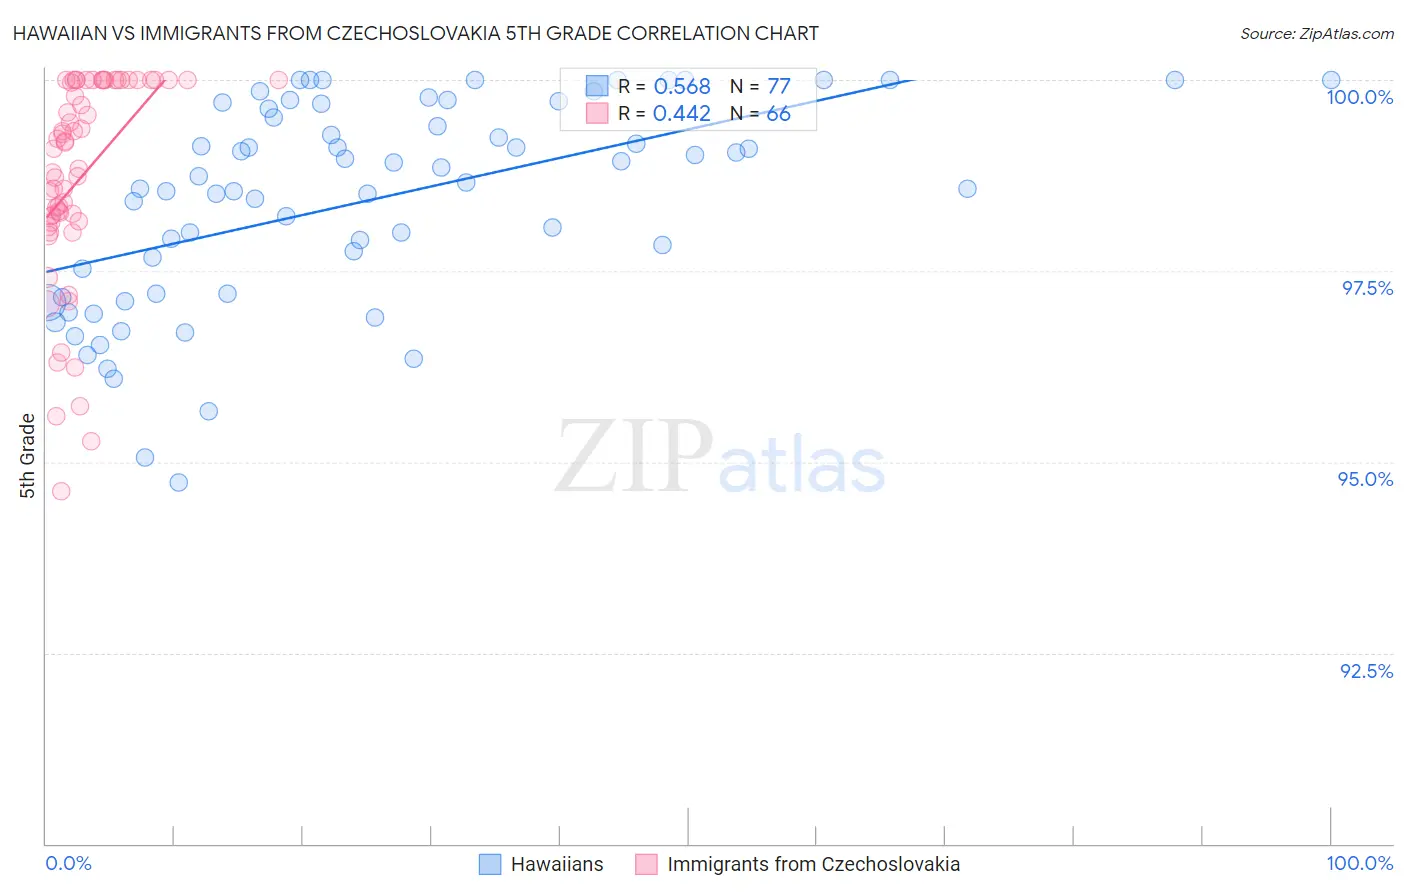
Hawaiian vs Immigrants from Czechoslovakia 5th Grade Correlation Chart
The statistical analysis conducted on geographies consisting of 327,621,279 people shows a substantial positive correlation between the proportion of Hawaiians and percentage of population with at least 5th grade education in the United States with a correlation coefficient (R) of 0.568 and weighted average of 97.2%. Similarly, the statistical analysis conducted on geographies consisting of 195,448,060 people shows a moderate positive correlation between the proportion of Immigrants from Czechoslovakia and percentage of population with at least 5th grade education in the United States with a correlation coefficient (R) of 0.442 and weighted average of 97.7%, a difference of 0.49%.
5th Grade Correlation Summary
| Measurement | Hawaiian | Immigrants from Czechoslovakia |
| Minimum | 94.7% | 94.6% |
| Maximum | 100.0% | 100.0% |
| Range | 5.3% | 5.4% |
| Mean | 98.4% | 98.7% |
| Median | 98.7% | 99.1% |
| Interquartile 25% (IQ1) | 97.2% | 98.2% |
| Interquartile 75% (IQ3) | 99.7% | 100.0% |
| Interquartile Range (IQR) | 2.5% | 1.8% |
| Standard Deviation (Sample) | 1.3% | 1.4% |
| Standard Deviation (Population) | 1.3% | 1.3% |
Similar Demographics by 5th Grade
Demographics Similar to Hawaiians by 5th Grade
In terms of 5th grade, the demographic groups most similar to Hawaiians are Brazilian (97.2%, a difference of 0.0%), Guamanian/Chamorro (97.2%, a difference of 0.010%), Navajo (97.2%, a difference of 0.020%), Immigrants from Albania (97.2%, a difference of 0.020%), and Black/African American (97.3%, a difference of 0.030%).
| Demographics | Rating | Rank | 5th Grade |
| Immigrants | Egypt | 32.9 /100 | #189 | Fair 97.3% |
| Blacks/African Americans | 31.8 /100 | #190 | Fair 97.3% |
| Immigrants | Brazil | 31.5 /100 | #191 | Fair 97.3% |
| Panamanians | 31.3 /100 | #192 | Fair 97.3% |
| Navajo | 29.0 /100 | #193 | Fair 97.2% |
| Immigrants | Albania | 28.5 /100 | #194 | Fair 97.2% |
| Guamanians/Chamorros | 26.8 /100 | #195 | Fair 97.2% |
| Hawaiians | 25.6 /100 | #196 | Fair 97.2% |
| Brazilians | 25.4 /100 | #197 | Fair 97.2% |
| Immigrants | Uganda | 21.1 /100 | #198 | Fair 97.2% |
| Natives/Alaskans | 18.0 /100 | #199 | Poor 97.2% |
| Immigrants | Northern Africa | 16.8 /100 | #200 | Poor 97.2% |
| Immigrants | Chile | 16.6 /100 | #201 | Poor 97.2% |
| Africans | 15.3 /100 | #202 | Poor 97.2% |
| Immigrants | Bahamas | 14.9 /100 | #203 | Poor 97.2% |
Demographics Similar to Immigrants from Czechoslovakia by 5th Grade
In terms of 5th grade, the demographic groups most similar to Immigrants from Czechoslovakia are Bhutanese (97.7%, a difference of 0.0%), Immigrants from Singapore (97.7%, a difference of 0.0%), German Russian (97.7%, a difference of 0.010%), Nonimmigrants (97.7%, a difference of 0.010%), and Choctaw (97.7%, a difference of 0.020%).
| Demographics | Rating | Rank | 5th Grade |
| Turks | 98.3 /100 | #99 | Exceptional 97.7% |
| Puget Sound Salish | 98.3 /100 | #100 | Exceptional 97.7% |
| South Africans | 98.3 /100 | #101 | Exceptional 97.7% |
| Choctaw | 98.0 /100 | #102 | Exceptional 97.7% |
| Cheyenne | 97.9 /100 | #103 | Exceptional 97.7% |
| German Russians | 97.8 /100 | #104 | Exceptional 97.7% |
| Bhutanese | 97.6 /100 | #105 | Exceptional 97.7% |
| Immigrants | Czechoslovakia | 97.5 /100 | #106 | Exceptional 97.7% |
| Immigrants | Singapore | 97.5 /100 | #107 | Exceptional 97.7% |
| Immigrants | Nonimmigrants | 97.3 /100 | #108 | Exceptional 97.7% |
| Immigrants | Latvia | 97.1 /100 | #109 | Exceptional 97.7% |
| Thais | 96.9 /100 | #110 | Exceptional 97.7% |
| Menominee | 96.3 /100 | #111 | Exceptional 97.7% |
| Immigrants | Switzerland | 96.0 /100 | #112 | Exceptional 97.7% |
| Iroquois | 95.9 /100 | #113 | Exceptional 97.7% |