Chippewa vs Kenyan 5th Grade

COMPARE

Chippewa
Race
Ancestry
AfghanAfricanAlaska NativeAlaskan AthabascanAlbanianAleutAlsatianAmericanApacheArabArapahoArgentineanArmenianAssyrian/Chaldean/SyriacAustralianAustrianBahamianBangladeshiBarbadianBasqueBelgianBelizeanBermudanBhutaneseBlackfeetBolivianBrazilianBritishBritish West IndianBulgarianBurmeseCajunCambodianCanadianCape VerdeanCarpatho RusynCelticCentral AmericanCentral American IndianCherokeeCheyenneChickasawChileanChineseChippewaChoctawColombianColvilleComancheCosta RicanCreeCreekCroatianCrowCubanCypriotCzechCzechoslovakianDanishDelawareDominicanDutchDutch West IndianEastern EuropeanEcuadorianEgyptianEnglishEstonianEthiopianEuropeanFijianFilipinoFinnishFrenchFrench American IndianFrench CanadianGermanGerman RussianGhanaianGreekGuamanian/ChamorroGuatemalanGuyaneseHaitianHmongHonduranHopiHoumaHungarianIcelanderIndian (Asian)IndonesianInupiatIranianIraqiIrishIroquoisIsraeliItalianJamaicanJapaneseJordanianKiowaKoreanLaotianLatvianLebaneseLiberianLithuanianLumbeeLuxembourgerMacedonianMalaysianMalteseMarshalleseMenomineeMexicanMexican American IndianMongolianMoroccanNative HawaiianNavajoNepaleseNew ZealanderNicaraguanNigerianNorthern EuropeanNorwegianOkinawanOsageOttawaPaiutePakistaniPalestinianPanamanianParaguayanPennsylvania GermanPeruvianPimaPolishPortuguesePotawatomiPuebloPuerto RicanPuget Sound SalishRomanianRussianSalvadoranSamoanScandinavianScotch-IrishScottishSeminoleSenegaleseSerbianShoshoneSierra LeoneanSiouxSlavicSlovakSloveneSomaliSouth AfricanSouth AmericanSouth American IndianSoviet UnionSpaniardSpanishSpanish AmericanSpanish American IndianSri LankanSubsaharan AfricanSudaneseSwedishSwissSyrianTaiwaneseThaiTlingit-HaidaTohono O'OdhamTonganTrinidadian and TobagonianTsimshianTurkishU.S. Virgin IslanderUgandanUkrainianUruguayanUteVenezuelanVietnameseWelshWest IndianYakamaYaquiYugoslavianYumanYup'ikZimbabwean
Immigration
NonimmigrantsImmigrantsAfghanistanAfricaAlbaniaArgentinaArmeniaAsiaAustraliaAustriaBahamasBangladeshBarbadosBelarusBelgiumBelizeBoliviaBosnia and HerzegovinaBrazilBulgariaBurma/MyanmarCabo VerdeCambodiaCameroonCanadaCaribbeanCentral AmericaChileChinaColombiaCongoCosta RicaCroatiaCubaCzechoslovakiaDenmarkDominicaDominican RepublicEastern AfricaEastern AsiaEastern EuropeEcuadorEgyptEl SalvadorEnglandEritreaEthiopiaEuropeFijiFranceGermanyGhanaGreeceGrenadaGuatemalaGuyanaHaitiHondurasHong KongHungaryIndiaIndonesiaIranIraqIrelandIsraelItalyJamaicaJapanJordanKazakhstanKenyaKoreaKuwaitLaosLatin AmericaLatviaLebanonLiberiaLithuaniaMalaysiaMexicoMicronesiaMiddle AfricaMoldovaMoroccoNepalNetherlandsNicaraguaNigeriaNorth AmericaNorth MacedoniaNorthern AfricaNorthern EuropeNorwayOceaniaPakistanPanamaPeruPhilippinesPolandPortugalRomaniaRussiaSaudi ArabiaScotlandSenegalSerbiaSierra LeoneSingaporeSomaliaSouth AfricaSouth AmericaSouth Central AsiaSouth Eastern AsiaSouthern EuropeSpainSri LankaSt. Vincent and the GrenadinesSudanSwedenSwitzerlandSyriaTaiwanThailandTrinidad and TobagoTurkeyUgandaUkraineUruguayUzbekistanVenezuelaVietnamWest IndiesWestern AfricaWestern AsiaWestern EuropeYemenZaireZimbabweAzores
Kenyan
Race
Ancestry
AfghanAfricanAlaska NativeAlaskan AthabascanAlbanianAleutAlsatianAmericanApacheArabArapahoArgentineanArmenianAssyrian/Chaldean/SyriacAustralianAustrianBahamianBangladeshiBarbadianBasqueBelgianBelizeanBermudanBhutaneseBlackfeetBolivianBrazilianBritishBritish West IndianBulgarianBurmeseCajunCambodianCanadianCape VerdeanCarpatho RusynCelticCentral AmericanCentral American IndianCherokeeCheyenneChickasawChileanChineseChoctawColombianColvilleComancheCosta RicanCreeCreekCroatianCrowCubanCypriotCzechCzechoslovakianDanishDelawareDominicanDutchDutch West IndianEastern EuropeanEcuadorianEgyptianEnglishEstonianEthiopianEuropeanFijianFilipinoFinnishFrenchFrench American IndianFrench CanadianGermanGerman RussianGhanaianGreekGuamanian/ChamorroGuatemalanGuyaneseHaitianHmongHonduranHopiHoumaHungarianIcelanderIndian (Asian)IndonesianInupiatIranianIraqiIrishIroquoisIsraeliItalianJamaicanJapaneseJordanianKenyanKiowaKoreanLaotianLatvianLebaneseLiberianLithuanianLumbeeLuxembourgerMacedonianMalaysianMalteseMarshalleseMenomineeMexicanMexican American IndianMongolianMoroccanNative HawaiianNavajoNepaleseNew ZealanderNicaraguanNigerianNorthern EuropeanNorwegianOkinawanOsageOttawaPaiutePakistaniPalestinianPanamanianParaguayanPennsylvania GermanPeruvianPimaPolishPortuguesePotawatomiPuebloPuerto RicanPuget Sound SalishRomanianRussianSalvadoranSamoanScandinavianScotch-IrishScottishSeminoleSenegaleseSerbianShoshoneSierra LeoneanSiouxSlavicSlovakSloveneSomaliSouth AfricanSouth AmericanSouth American IndianSoviet UnionSpaniardSpanishSpanish AmericanSpanish American IndianSri LankanSubsaharan AfricanSudaneseSwedishSwissSyrianTaiwaneseThaiTlingit-HaidaTohono O'OdhamTonganTrinidadian and TobagonianTsimshianTurkishU.S. Virgin IslanderUgandanUkrainianUruguayanUteVenezuelanVietnameseWelshWest IndianYakamaYaquiYugoslavianYumanYup'ikZimbabwean
Immigration
NonimmigrantsImmigrantsAfghanistanAfricaAlbaniaArgentinaArmeniaAsiaAustraliaAustriaBahamasBangladeshBarbadosBelarusBelgiumBelizeBoliviaBosnia and HerzegovinaBrazilBulgariaBurma/MyanmarCabo VerdeCambodiaCameroonCanadaCaribbeanCentral AmericaChileChinaColombiaCongoCosta RicaCroatiaCubaCzechoslovakiaDenmarkDominicaDominican RepublicEastern AfricaEastern AsiaEastern EuropeEcuadorEgyptEl SalvadorEnglandEritreaEthiopiaEuropeFijiFranceGermanyGhanaGreeceGrenadaGuatemalaGuyanaHaitiHondurasHong KongHungaryIndiaIndonesiaIranIraqIrelandIsraelItalyJamaicaJapanJordanKazakhstanKenyaKoreaKuwaitLaosLatin AmericaLatviaLebanonLiberiaLithuaniaMalaysiaMexicoMicronesiaMiddle AfricaMoldovaMoroccoNepalNetherlandsNicaraguaNigeriaNorth AmericaNorth MacedoniaNorthern AfricaNorthern EuropeNorwayOceaniaPakistanPanamaPeruPhilippinesPolandPortugalRomaniaRussiaSaudi ArabiaScotlandSenegalSerbiaSierra LeoneSingaporeSomaliaSouth AfricaSouth AmericaSouth Central AsiaSouth Eastern AsiaSouthern EuropeSpainSri LankaSt. Vincent and the GrenadinesSudanSwedenSwitzerlandSyriaTaiwanThailandTrinidad and TobagoTurkeyUgandaUkraineUruguayUzbekistanVenezuelaVietnamWest IndiesWestern AfricaWestern AsiaWestern EuropeYemenZaireZimbabweAzores
5th Grade
Income
Poverty
Unemployment
Labor Participation
Family Structure
Vehicle Availability
Education Level
Disability

5th Grade Comparison

Chippewa

Kenyans

Exceptional
Average
98.1%
5TH GRADE
100.0/ 100
METRIC RATING
32nd/ 347
METRIC RANK
97.4%
5TH GRADE
59.7/ 100
METRIC RATING
161st/ 347
METRIC RANK

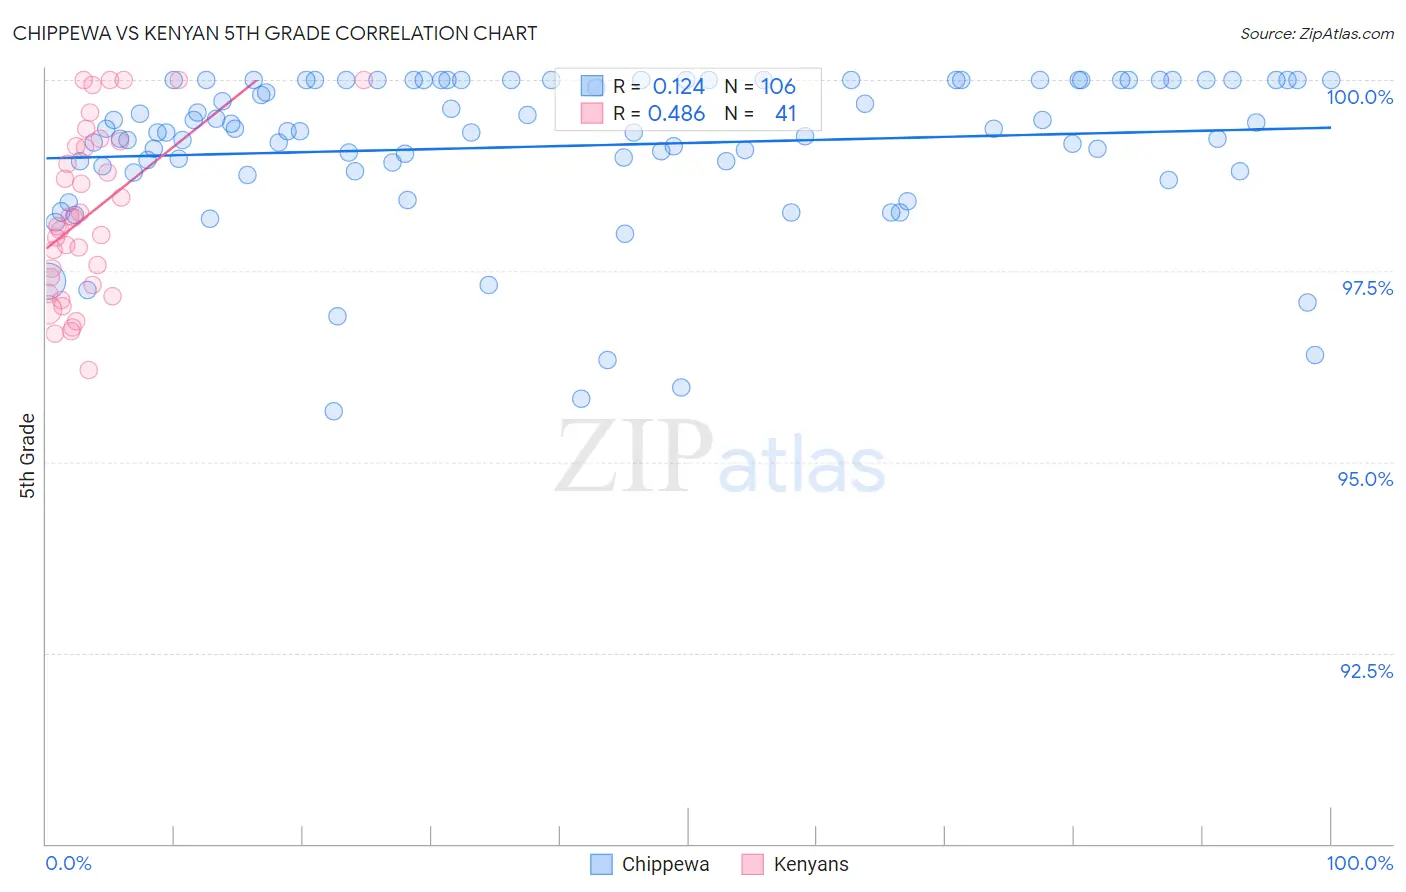
Chippewa vs Kenyan 5th Grade Correlation Chart

The statistical analysis conducted on geographies consisting of 215,065,644 people shows a poor positive correlation between the proportion of Chippewa and percentage of population with at least 5th grade education in the United States with a correlation coefficient (R) of 0.124 and weighted average of 98.1%. Similarly, the statistical analysis conducted on geographies consisting of 168,244,042 people shows a moderate positive correlation between the proportion of Kenyans and percentage of population with at least 5th grade education in the United States with a correlation coefficient (R) of 0.486 and weighted average of 97.4%, a difference of 0.78%.
Chippewa vs Kenyan 5th Grade

5th Grade Correlation Summary

MeasurementChippewaKenyan
Minimum95.7%96.2%
Maximum100.0%100.0%
Range4.3%3.8%
Mean99.1%98.2%
Median99.3%98.1%
Interquartile 25% (IQ1)98.9%97.3%
Interquartile 75% (IQ3)100.0%99.2%
Interquartile Range (IQR)1.1%1.9%
Standard Deviation (Sample)1.0%1.1%
Standard Deviation (Population)1.0%1.1%

Similar Demographics by 5th Grade

Demographics Similar to Chippewa by 5th Grade

In terms of 5th grade, the demographic groups most similar to Chippewa are Swiss (98.1%, a difference of 0.010%), Chinese (98.1%, a difference of 0.010%), Italian (98.1%, a difference of 0.020%), British (98.1%, a difference of 0.030%), and European (98.2%, a difference of 0.040%).
DemographicsRating | Rank5th Grade
Yup'ik
100.0
/100
|
#25
Exceptional
98.2%
Alaska Natives
100.0
/100
|
#26
Exceptional
98.2%
French
100.0
/100
|
#27
Exceptional
98.2%
Czechs
100.0
/100
|
#28
Exceptional
98.2%
Scandinavians
100.0
/100
|
#29
Exceptional
98.2%
French Canadians
100.0
/100
|
#30
Exceptional
98.2%
Europeans
100.0
/100
|
#31
Exceptional
98.2%
Chippewa
100.0
/100
|
#32
Exceptional
98.1%
Swiss
100.0
/100
|
#33
Exceptional
98.1%
Chinese
100.0
/100
|
#34
Exceptional
98.1%
Italians
100.0
/100
|
#35
Exceptional
98.1%
British
100.0
/100
|
#36
Exceptional
98.1%
Latvians
99.9
/100
|
#37
Exceptional
98.1%
Belgians
99.9
/100
|
#38
Exceptional
98.1%
Luxembourgers
99.9
/100
|
#39
Exceptional
98.1%

Demographics Similar to Kenyans by 5th Grade

In terms of 5th grade, the demographic groups most similar to Kenyans are Immigrants from Iran (97.4%, a difference of 0.0%), Ugandan (97.4%, a difference of 0.0%), Bermudan (97.4%, a difference of 0.0%), Marshallese (97.4%, a difference of 0.010%), and Immigrants from Poland (97.4%, a difference of 0.010%).
DemographicsRating | Rank5th Grade
Immigrants | Russia
71.2
/100
|
#154
Good
97.4%
Immigrants | Bosnia and Herzegovina
71.0
/100
|
#155
Good
97.4%
French American Indians
70.5
/100
|
#156
Good
97.4%
Immigrants | Jordan
70.4
/100
|
#157
Good
97.4%
Albanians
68.3
/100
|
#158
Good
97.4%
Immigrants | Italy
65.2
/100
|
#159
Good
97.4%
Marshallese
61.2
/100
|
#160
Good
97.4%
Kenyans
59.7
/100
|
#161
Average
97.4%
Immigrants | Iran
59.5
/100
|
#162
Average
97.4%
Ugandans
58.9
/100
|
#163
Average
97.4%
Bermudans
58.8
/100
|
#164
Average
97.4%
Immigrants | Poland
57.9
/100
|
#165
Average
97.4%
Apache
57.2
/100
|
#166
Average
97.4%
Immigrants | Belarus
54.6
/100
|
#167
Average
97.3%
Chileans
54.5
/100
|
#168
Average
97.3%