Chippewa vs Fijian College, 1 year or more
COMPARE
Chippewa
Fijian
College, 1 year or more
College, 1 year or more Comparison
Chippewa
Fijians
55.7%
COLLEGE, 1 YEAR OR MORE
0.9/ 100
METRIC RATING
244th/ 347
METRIC RANK
51.3%
COLLEGE, 1 YEAR OR MORE
0.0/ 100
METRIC RATING
314th/ 347
METRIC RANK
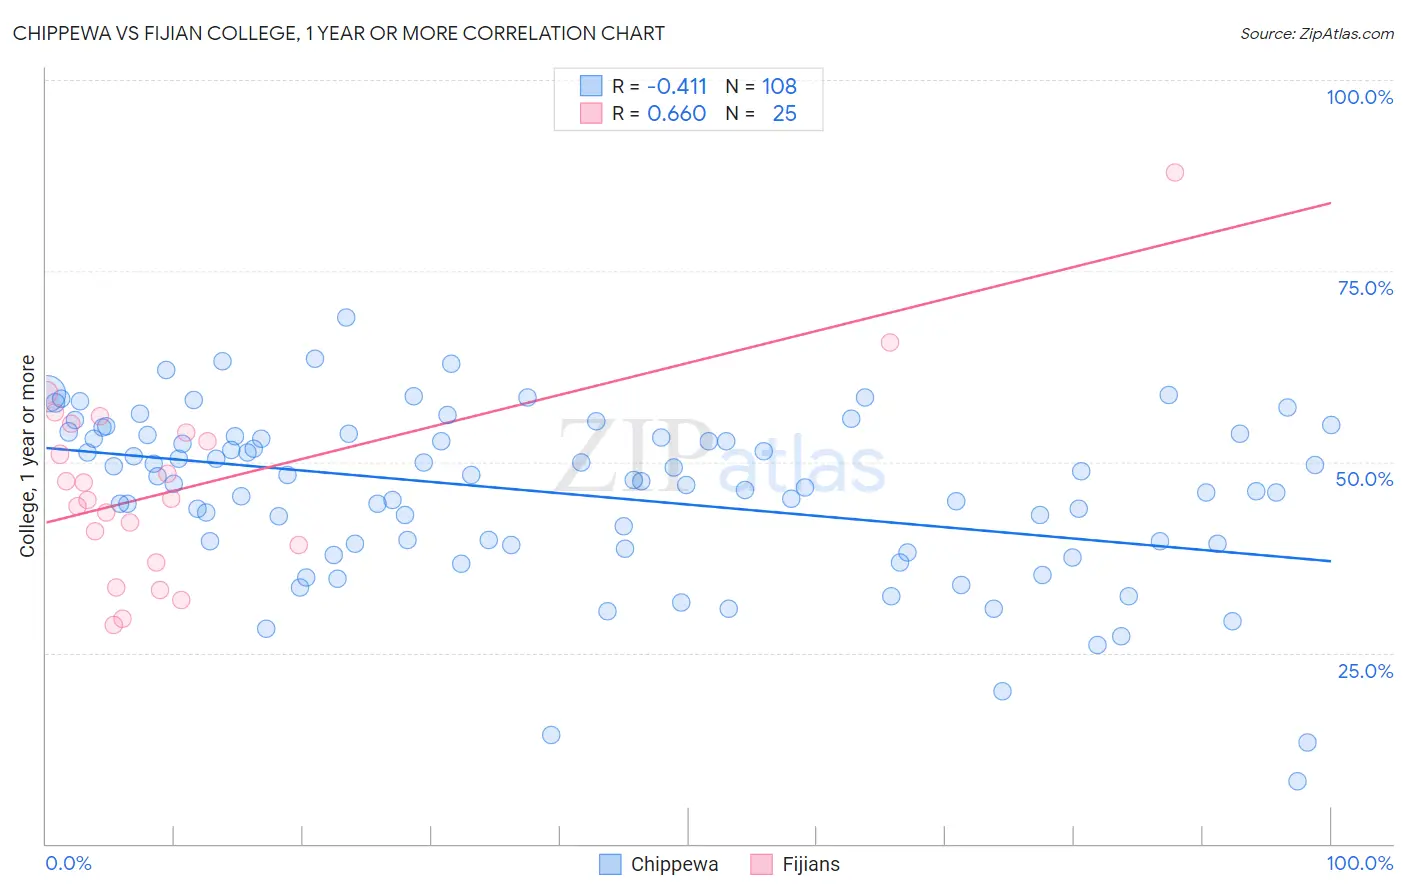
Chippewa vs Fijian College, 1 year or more Correlation Chart
The statistical analysis conducted on geographies consisting of 215,068,137 people shows a moderate negative correlation between the proportion of Chippewa and percentage of population with at least college, 1 year or more education in the United States with a correlation coefficient (R) of -0.411 and weighted average of 55.7%. Similarly, the statistical analysis conducted on geographies consisting of 55,948,842 people shows a significant positive correlation between the proportion of Fijians and percentage of population with at least college, 1 year or more education in the United States with a correlation coefficient (R) of 0.660 and weighted average of 51.3%, a difference of 8.5%.
College, 1 year or more Correlation Summary
| Measurement | Chippewa | Fijian |
| Minimum | 8.2% | 28.6% |
| Maximum | 68.9% | 87.8% |
| Range | 60.6% | 59.3% |
| Mean | 45.8% | 47.0% |
| Median | 47.6% | 45.2% |
| Interquartile 25% (IQ1) | 39.3% | 38.0% |
| Interquartile 75% (IQ3) | 53.4% | 54.4% |
| Interquartile Range (IQR) | 14.2% | 16.4% |
| Standard Deviation (Sample) | 11.1% | 12.9% |
| Standard Deviation (Population) | 11.0% | 12.6% |
Similar Demographics by College, 1 year or more
Demographics Similar to Chippewa by College, 1 year or more
In terms of college, 1 year or more, the demographic groups most similar to Chippewa are Immigrants from Liberia (55.7%, a difference of 0.070%), Malaysian (55.6%, a difference of 0.11%), Osage (55.8%, a difference of 0.12%), Marshallese (55.8%, a difference of 0.13%), and Hawaiian (55.6%, a difference of 0.19%).
| Demographics | Rating | Rank | College, 1 year or more |
| Samoans | 1.6 /100 | #237 | Tragic 56.2% |
| Barbadians | 1.3 /100 | #238 | Tragic 56.0% |
| Puget Sound Salish | 1.1 /100 | #239 | Tragic 55.9% |
| Trinidadians and Tobagonians | 1.1 /100 | #240 | Tragic 55.8% |
| French American Indians | 1.0 /100 | #241 | Tragic 55.8% |
| Marshallese | 1.0 /100 | #242 | Tragic 55.8% |
| Osage | 1.0 /100 | #243 | Tragic 55.8% |
| Chippewa | 0.9 /100 | #244 | Tragic 55.7% |
| Immigrants | Liberia | 0.8 /100 | #245 | Tragic 55.7% |
| Malaysians | 0.8 /100 | #246 | Tragic 55.6% |
| Hawaiians | 0.8 /100 | #247 | Tragic 55.6% |
| Immigrants | Congo | 0.8 /100 | #248 | Tragic 55.6% |
| Immigrants | Trinidad and Tobago | 0.7 /100 | #249 | Tragic 55.5% |
| Delaware | 0.7 /100 | #250 | Tragic 55.5% |
| Immigrants | Cambodia | 0.6 /100 | #251 | Tragic 55.4% |
Demographics Similar to Fijians by College, 1 year or more
In terms of college, 1 year or more, the demographic groups most similar to Fijians are Immigrants from Caribbean (51.4%, a difference of 0.22%), Guatemalan (51.2%, a difference of 0.23%), Cajun (51.2%, a difference of 0.30%), Pueblo (51.5%, a difference of 0.35%), and Immigrants from Haiti (51.5%, a difference of 0.39%).
| Demographics | Rating | Rank | College, 1 year or more |
| Immigrants | Portugal | 0.0 /100 | #307 | Tragic 51.9% |
| Salvadorans | 0.0 /100 | #308 | Tragic 51.8% |
| Apache | 0.0 /100 | #309 | Tragic 51.8% |
| Hondurans | 0.0 /100 | #310 | Tragic 51.6% |
| Immigrants | Haiti | 0.0 /100 | #311 | Tragic 51.5% |
| Pueblo | 0.0 /100 | #312 | Tragic 51.5% |
| Immigrants | Caribbean | 0.0 /100 | #313 | Tragic 51.4% |
| Fijians | 0.0 /100 | #314 | Tragic 51.3% |
| Guatemalans | 0.0 /100 | #315 | Tragic 51.2% |
| Cajuns | 0.0 /100 | #316 | Tragic 51.2% |
| Hispanics or Latinos | 0.0 /100 | #317 | Tragic 51.1% |
| Immigrants | Honduras | 0.0 /100 | #318 | Tragic 51.0% |
| Immigrants | El Salvador | 0.0 /100 | #319 | Tragic 51.0% |
| Kiowa | 0.0 /100 | #320 | Tragic 51.0% |
| Hopi | 0.0 /100 | #321 | Tragic 50.9% |