Chippewa vs Cheyenne Householder Income Over 65 years
COMPARE
Chippewa
Cheyenne
Householder Income Over 65 years
Householder Income Over 65 years Comparison
Chippewa
Cheyenne
$53,847
HOUSEHOLDER INCOME OVER 65 YEARS
0.1/ 100
METRIC RATING
286th/ 347
METRIC RANK
$54,096
HOUSEHOLDER INCOME OVER 65 YEARS
0.1/ 100
METRIC RATING
277th/ 347
METRIC RANK
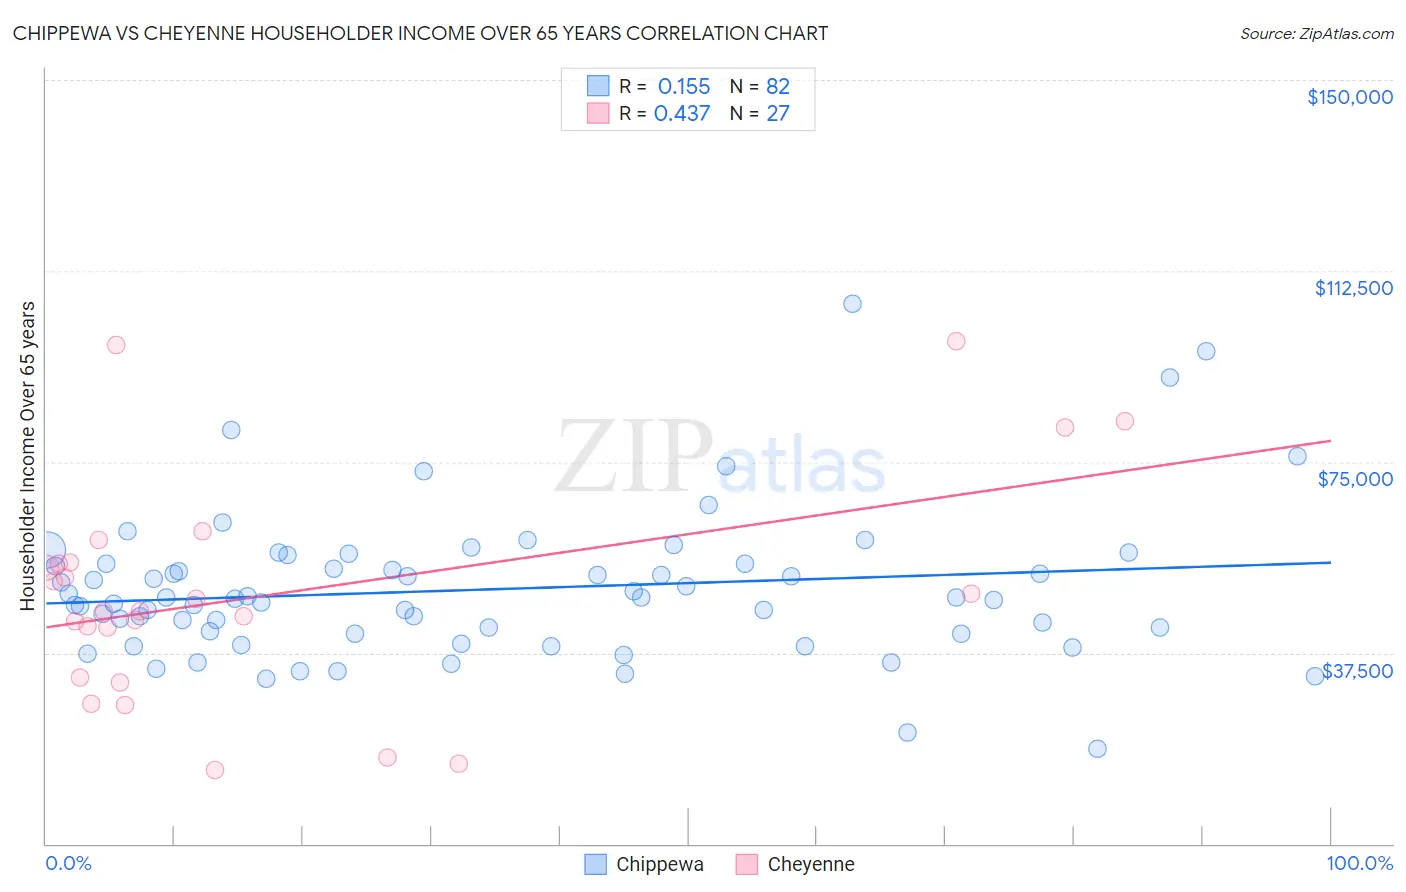
Chippewa vs Cheyenne Householder Income Over 65 years Correlation Chart
The statistical analysis conducted on geographies consisting of 214,439,477 people shows a poor positive correlation between the proportion of Chippewa and household income with householder over the age of 65 in the United States with a correlation coefficient (R) of 0.155 and weighted average of $53,847. Similarly, the statistical analysis conducted on geographies consisting of 80,656,378 people shows a moderate positive correlation between the proportion of Cheyenne and household income with householder over the age of 65 in the United States with a correlation coefficient (R) of 0.437 and weighted average of $54,096, a difference of 0.46%.
Householder Income Over 65 years Correlation Summary
| Measurement | Chippewa | Cheyenne |
| Minimum | $18,750 | $14,422 |
| Maximum | $105,938 | $98,750 |
| Range | $87,188 | $84,328 |
| Mean | $49,957 | $48,996 |
| Median | $48,230 | $45,764 |
| Interquartile 25% (IQ1) | $41,250 | $32,697 |
| Interquartile 75% (IQ3) | $55,000 | $55,318 |
| Interquartile Range (IQR) | $13,750 | $22,620 |
| Standard Deviation (Sample) | $14,463 | $21,930 |
| Standard Deviation (Population) | $14,375 | $21,520 |
Demographics Similar to Chippewa and Cheyenne by Householder Income Over 65 years
In terms of householder income over 65 years, the demographic groups most similar to Chippewa are Mexican ($53,897, a difference of 0.090%), Immigrants from Barbados ($53,766, a difference of 0.15%), Paiute ($53,762, a difference of 0.16%), Immigrants from Guatemala ($53,950, a difference of 0.19%), and Iroquois ($53,737, a difference of 0.21%). Similarly, the demographic groups most similar to Cheyenne are Cree ($54,129, a difference of 0.060%), Cherokee ($54,133, a difference of 0.070%), Barbadian ($54,163, a difference of 0.12%), Immigrants from Ecuador ($54,030, a difference of 0.12%), and Blackfeet ($54,029, a difference of 0.12%).
| Demographics | Rating | Rank | Householder Income Over 65 years |
| Liberians | 0.1 /100 | #271 | Tragic $54,356 |
| Potawatomi | 0.1 /100 | #272 | Tragic $54,212 |
| Indonesians | 0.1 /100 | #273 | Tragic $54,176 |
| Barbadians | 0.1 /100 | #274 | Tragic $54,163 |
| Cherokee | 0.1 /100 | #275 | Tragic $54,133 |
| Cree | 0.1 /100 | #276 | Tragic $54,129 |
| Cheyenne | 0.1 /100 | #277 | Tragic $54,096 |
| Immigrants | Ecuador | 0.1 /100 | #278 | Tragic $54,030 |
| Blackfeet | 0.1 /100 | #279 | Tragic $54,029 |
| Immigrants | Jamaica | 0.1 /100 | #280 | Tragic $54,027 |
| Somalis | 0.1 /100 | #281 | Tragic $54,004 |
| Immigrants | Armenia | 0.1 /100 | #282 | Tragic $53,974 |
| Immigrants | Liberia | 0.1 /100 | #283 | Tragic $53,967 |
| Immigrants | Guatemala | 0.1 /100 | #284 | Tragic $53,950 |
| Mexicans | 0.1 /100 | #285 | Tragic $53,897 |
| Chippewa | 0.1 /100 | #286 | Tragic $53,847 |
| Immigrants | Barbados | 0.1 /100 | #287 | Tragic $53,766 |
| Paiute | 0.1 /100 | #288 | Tragic $53,762 |
| Iroquois | 0.1 /100 | #289 | Tragic $53,737 |
| Chickasaw | 0.1 /100 | #290 | Tragic $53,732 |
| Africans | 0.0 /100 | #291 | Tragic $53,711 |