Chippewa vs Venezuelan Master's Degree
COMPARE
Chippewa
Venezuelan
Master's Degree
Master's Degree Comparison
Chippewa
Venezuelans
11.4%
MASTER'S DEGREE
0.1/ 100
METRIC RATING
300th/ 347
METRIC RANK
15.9%
MASTER'S DEGREE
88.4/ 100
METRIC RATING
134th/ 347
METRIC RANK
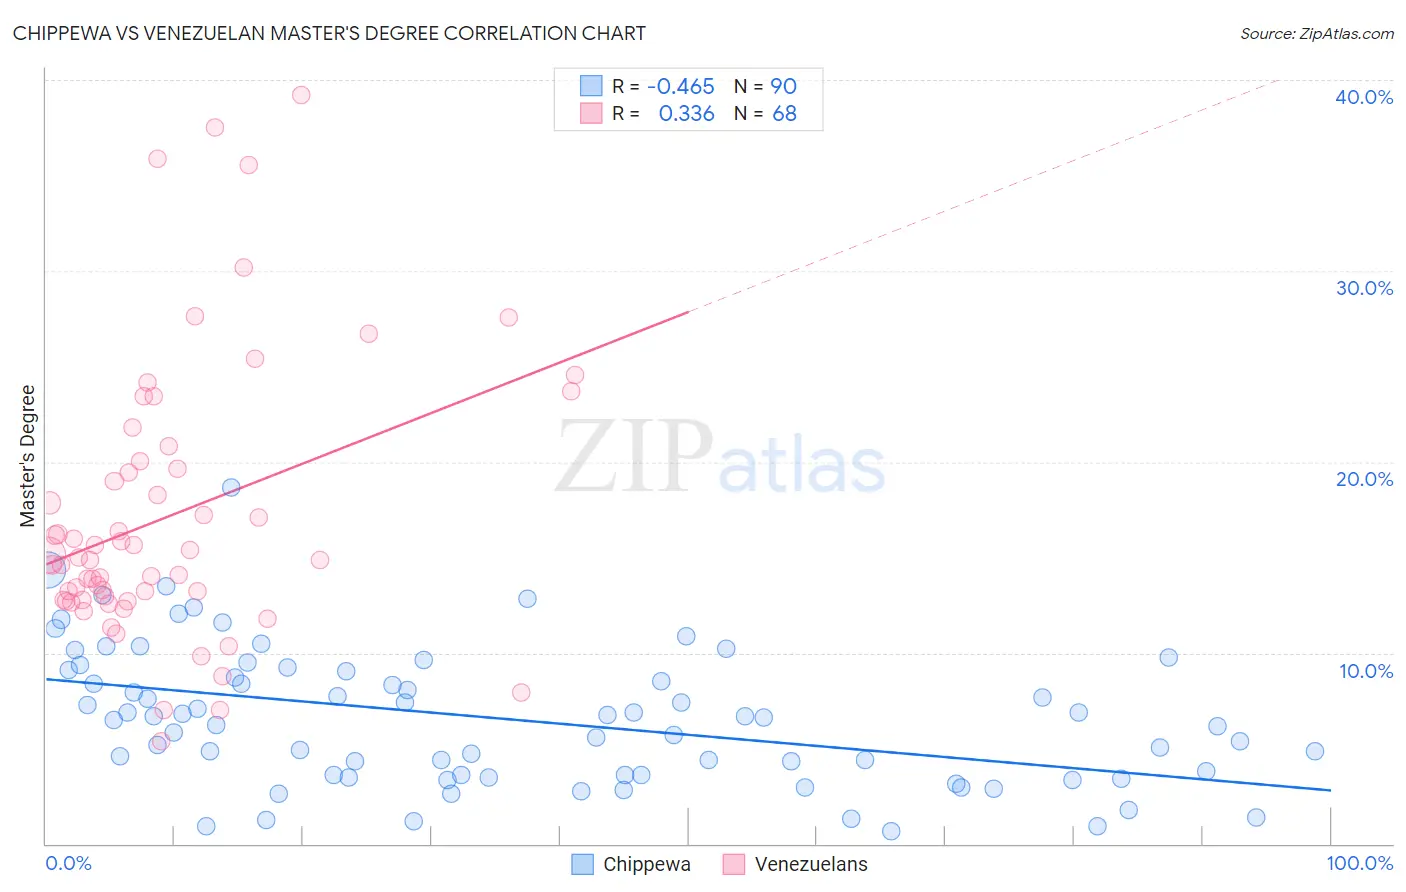
Chippewa vs Venezuelan Master's Degree Correlation Chart
The statistical analysis conducted on geographies consisting of 215,015,908 people shows a moderate negative correlation between the proportion of Chippewa and percentage of population with at least master's degree education in the United States with a correlation coefficient (R) of -0.465 and weighted average of 11.4%. Similarly, the statistical analysis conducted on geographies consisting of 306,249,959 people shows a mild positive correlation between the proportion of Venezuelans and percentage of population with at least master's degree education in the United States with a correlation coefficient (R) of 0.336 and weighted average of 15.9%, a difference of 39.2%.
Master's Degree Correlation Summary
| Measurement | Chippewa | Venezuelan |
| Minimum | 0.64% | 5.4% |
| Maximum | 18.7% | 39.2% |
| Range | 18.0% | 33.8% |
| Mean | 6.5% | 17.1% |
| Median | 6.6% | 14.9% |
| Interquartile 25% (IQ1) | 3.6% | 12.8% |
| Interquartile 75% (IQ3) | 9.0% | 19.8% |
| Interquartile Range (IQR) | 5.4% | 7.1% |
| Standard Deviation (Sample) | 3.6% | 7.2% |
| Standard Deviation (Population) | 3.5% | 7.2% |
Similar Demographics by Master's Degree
Demographics Similar to Chippewa by Master's Degree
In terms of master's degree, the demographic groups most similar to Chippewa are Chickasaw (11.4%, a difference of 0.020%), Tsimshian (11.4%, a difference of 0.16%), Cherokee (11.4%, a difference of 0.47%), Samoan (11.5%, a difference of 0.48%), and Immigrants from Laos (11.4%, a difference of 0.49%).
| Demographics | Rating | Rank | Master's Degree |
| Alaska Natives | 0.1 /100 | #293 | Tragic 11.6% |
| Hawaiians | 0.1 /100 | #294 | Tragic 11.6% |
| Marshallese | 0.1 /100 | #295 | Tragic 11.6% |
| Alaskan Athabascans | 0.1 /100 | #296 | Tragic 11.6% |
| Immigrants | Yemen | 0.1 /100 | #297 | Tragic 11.6% |
| Samoans | 0.1 /100 | #298 | Tragic 11.5% |
| Chickasaw | 0.1 /100 | #299 | Tragic 11.4% |
| Chippewa | 0.1 /100 | #300 | Tragic 11.4% |
| Tsimshian | 0.1 /100 | #301 | Tragic 11.4% |
| Cherokee | 0.1 /100 | #302 | Tragic 11.4% |
| Immigrants | Laos | 0.1 /100 | #303 | Tragic 11.4% |
| Immigrants | Cabo Verde | 0.1 /100 | #304 | Tragic 11.3% |
| Immigrants | Latin America | 0.0 /100 | #305 | Tragic 11.3% |
| Mexican American Indians | 0.0 /100 | #306 | Tragic 11.2% |
| Cheyenne | 0.0 /100 | #307 | Tragic 11.2% |
Demographics Similar to Venezuelans by Master's Degree
In terms of master's degree, the demographic groups most similar to Venezuelans are South American Indian (15.9%, a difference of 0.0%), Assyrian/Chaldean/Syriac (15.8%, a difference of 0.45%), Immigrants from Sudan (16.0%, a difference of 0.56%), European (15.8%, a difference of 0.56%), and Pakistani (15.8%, a difference of 0.64%).
| Demographics | Rating | Rank | Master's Degree |
| Palestinians | 94.8 /100 | #127 | Exceptional 16.3% |
| Immigrants | Sierra Leone | 94.7 /100 | #128 | Exceptional 16.3% |
| Immigrants | Syria | 93.3 /100 | #129 | Exceptional 16.2% |
| Immigrants | Jordan | 92.7 /100 | #130 | Exceptional 16.1% |
| Taiwanese | 91.9 /100 | #131 | Exceptional 16.1% |
| Serbians | 91.7 /100 | #132 | Exceptional 16.1% |
| Immigrants | Sudan | 90.2 /100 | #133 | Exceptional 16.0% |
| Venezuelans | 88.4 /100 | #134 | Excellent 15.9% |
| South American Indians | 88.4 /100 | #135 | Excellent 15.9% |
| Assyrians/Chaldeans/Syriacs | 86.8 /100 | #136 | Excellent 15.8% |
| Europeans | 86.4 /100 | #137 | Excellent 15.8% |
| Pakistanis | 86.1 /100 | #138 | Excellent 15.8% |
| Immigrants | Germany | 85.9 /100 | #139 | Excellent 15.8% |
| Vietnamese | 85.5 /100 | #140 | Excellent 15.8% |
| Poles | 85.0 /100 | #141 | Excellent 15.7% |