Finnish vs Immigrants from Guatemala College, 1 year or more
COMPARE
Finnish
Immigrants from Guatemala
College, 1 year or more
College, 1 year or more Comparison
Finns
Immigrants from Guatemala
60.2%
COLLEGE, 1 YEAR OR MORE
72.9/ 100
METRIC RATING
156th/ 347
METRIC RANK
50.7%
COLLEGE, 1 YEAR OR MORE
0.0/ 100
METRIC RATING
323rd/ 347
METRIC RANK
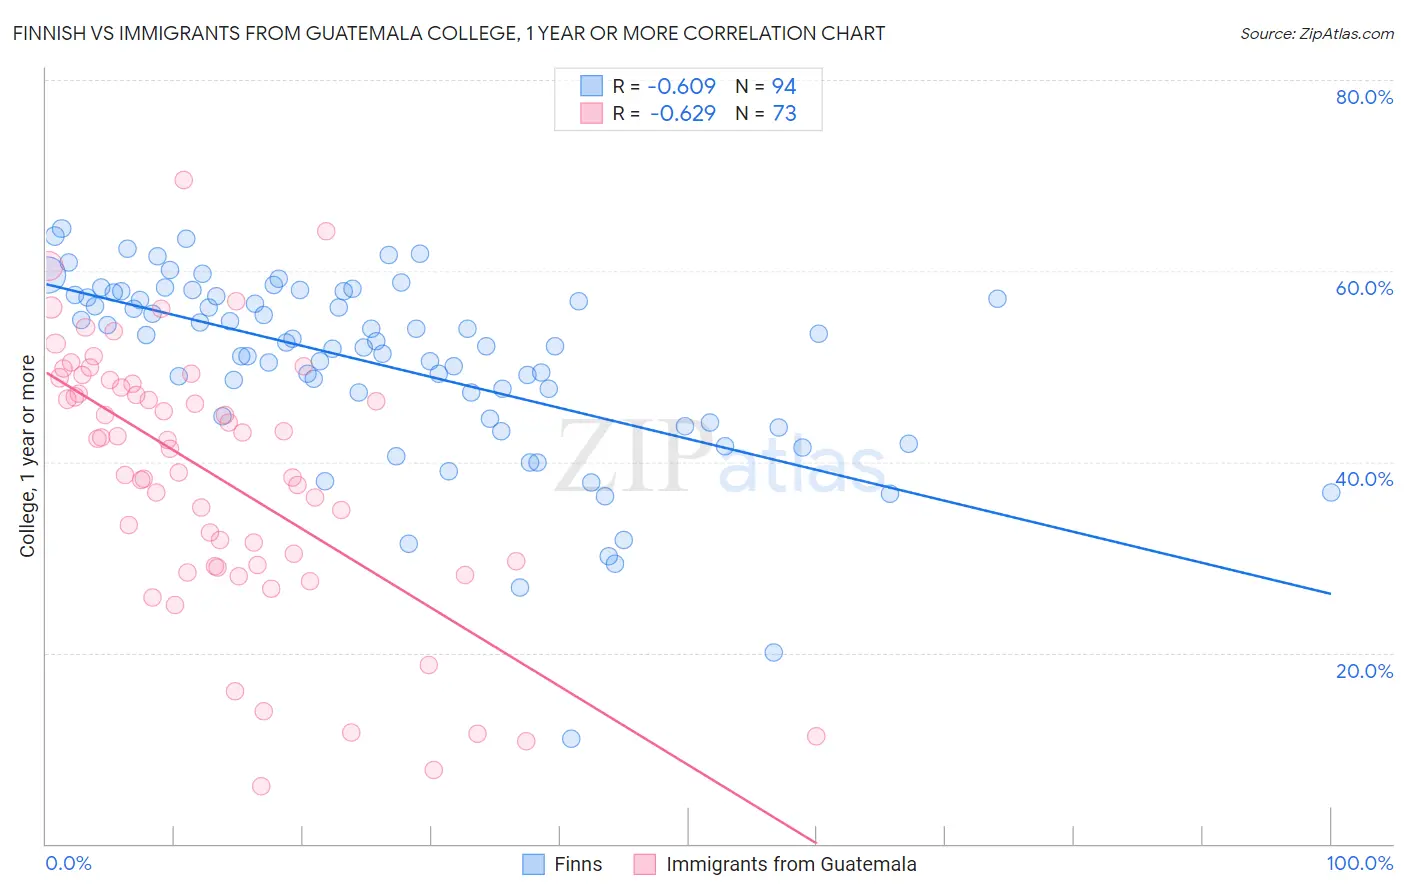
Finnish vs Immigrants from Guatemala College, 1 year or more Correlation Chart
The statistical analysis conducted on geographies consisting of 404,673,514 people shows a significant negative correlation between the proportion of Finns and percentage of population with at least college, 1 year or more education in the United States with a correlation coefficient (R) of -0.609 and weighted average of 60.2%. Similarly, the statistical analysis conducted on geographies consisting of 377,285,447 people shows a significant negative correlation between the proportion of Immigrants from Guatemala and percentage of population with at least college, 1 year or more education in the United States with a correlation coefficient (R) of -0.629 and weighted average of 50.7%, a difference of 18.7%.
College, 1 year or more Correlation Summary
| Measurement | Finnish | Immigrants from Guatemala |
| Minimum | 11.0% | 6.0% |
| Maximum | 64.4% | 69.5% |
| Range | 53.4% | 63.5% |
| Mean | 50.1% | 38.6% |
| Median | 52.3% | 42.3% |
| Interquartile 25% (IQ1) | 44.5% | 29.2% |
| Interquartile 75% (IQ3) | 57.3% | 48.4% |
| Interquartile Range (IQR) | 12.8% | 19.2% |
| Standard Deviation (Sample) | 10.0% | 13.8% |
| Standard Deviation (Population) | 9.9% | 13.7% |
Similar Demographics by College, 1 year or more
Demographics Similar to Finns by College, 1 year or more
In terms of college, 1 year or more, the demographic groups most similar to Finns are Sudanese (60.2%, a difference of 0.0%), Moroccan (60.2%, a difference of 0.0%), Sierra Leonean (60.2%, a difference of 0.080%), Immigrants from Germany (60.3%, a difference of 0.22%), and Immigrants from Armenia (60.0%, a difference of 0.26%).
| Demographics | Rating | Rank | College, 1 year or more |
| Brazilians | 79.0 /100 | #149 | Good 60.5% |
| Immigrants | Sudan | 77.8 /100 | #150 | Good 60.4% |
| Albanians | 77.8 /100 | #151 | Good 60.4% |
| Immigrants | Germany | 76.1 /100 | #152 | Good 60.3% |
| Sierra Leoneans | 74.1 /100 | #153 | Good 60.2% |
| Sudanese | 73.0 /100 | #154 | Good 60.2% |
| Moroccans | 72.9 /100 | #155 | Good 60.2% |
| Finns | 72.9 /100 | #156 | Good 60.2% |
| Immigrants | Armenia | 68.8 /100 | #157 | Good 60.0% |
| English | 67.2 /100 | #158 | Good 60.0% |
| Immigrants | Iraq | 67.0 /100 | #159 | Good 60.0% |
| South American Indians | 66.9 /100 | #160 | Good 60.0% |
| Somalis | 64.5 /100 | #161 | Good 59.9% |
| Koreans | 58.5 /100 | #162 | Average 59.7% |
| Immigrants | Somalia | 58.3 /100 | #163 | Average 59.7% |
Demographics Similar to Immigrants from Guatemala by College, 1 year or more
In terms of college, 1 year or more, the demographic groups most similar to Immigrants from Guatemala are Immigrants from Cuba (50.7%, a difference of 0.010%), Immigrants from Latin America (50.7%, a difference of 0.040%), Dominican (50.6%, a difference of 0.22%), Navajo (50.8%, a difference of 0.23%), and Menominee (50.6%, a difference of 0.26%).
| Demographics | Rating | Rank | College, 1 year or more |
| Cajuns | 0.0 /100 | #316 | Tragic 51.2% |
| Hispanics or Latinos | 0.0 /100 | #317 | Tragic 51.1% |
| Immigrants | Honduras | 0.0 /100 | #318 | Tragic 51.0% |
| Immigrants | El Salvador | 0.0 /100 | #319 | Tragic 51.0% |
| Kiowa | 0.0 /100 | #320 | Tragic 51.0% |
| Hopi | 0.0 /100 | #321 | Tragic 50.9% |
| Navajo | 0.0 /100 | #322 | Tragic 50.8% |
| Immigrants | Guatemala | 0.0 /100 | #323 | Tragic 50.7% |
| Immigrants | Cuba | 0.0 /100 | #324 | Tragic 50.7% |
| Immigrants | Latin America | 0.0 /100 | #325 | Tragic 50.7% |
| Dominicans | 0.0 /100 | #326 | Tragic 50.6% |
| Menominee | 0.0 /100 | #327 | Tragic 50.6% |
| Dutch West Indians | 0.0 /100 | #328 | Tragic 50.5% |
| Cape Verdeans | 0.0 /100 | #329 | Tragic 50.3% |
| Natives/Alaskans | 0.0 /100 | #330 | Tragic 50.2% |