Immigrants from Jordan vs Immigrants from Guatemala College, 1 year or more
COMPARE
Immigrants from Jordan
Immigrants from Guatemala
College, 1 year or more
College, 1 year or more Comparison
Immigrants from Jordan
Immigrants from Guatemala
61.4%
COLLEGE, 1 YEAR OR MORE
92.7/ 100
METRIC RATING
121st/ 347
METRIC RANK
50.7%
COLLEGE, 1 YEAR OR MORE
0.0/ 100
METRIC RATING
323rd/ 347
METRIC RANK
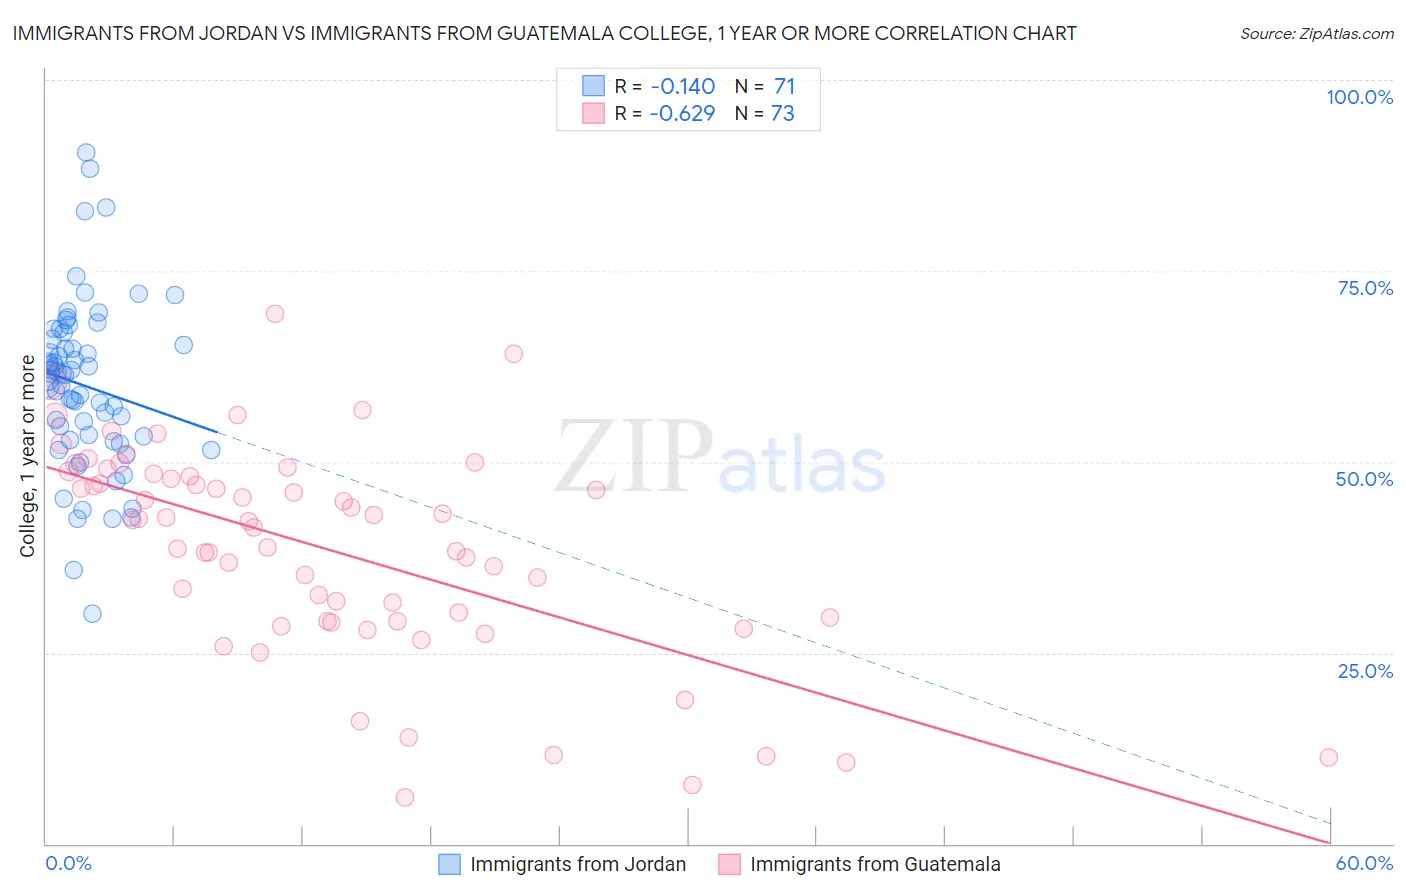
Immigrants from Jordan vs Immigrants from Guatemala College, 1 year or more Correlation Chart
The statistical analysis conducted on geographies consisting of 181,276,954 people shows a poor negative correlation between the proportion of Immigrants from Jordan and percentage of population with at least college, 1 year or more education in the United States with a correlation coefficient (R) of -0.140 and weighted average of 61.4%. Similarly, the statistical analysis conducted on geographies consisting of 377,285,447 people shows a significant negative correlation between the proportion of Immigrants from Guatemala and percentage of population with at least college, 1 year or more education in the United States with a correlation coefficient (R) of -0.629 and weighted average of 50.7%, a difference of 21.1%.
College, 1 year or more Correlation Summary
| Measurement | Immigrants from Jordan | Immigrants from Guatemala |
| Minimum | 30.1% | 6.0% |
| Maximum | 90.5% | 69.5% |
| Range | 60.3% | 63.5% |
| Mean | 60.0% | 38.6% |
| Median | 61.3% | 42.3% |
| Interquartile 25% (IQ1) | 52.9% | 29.2% |
| Interquartile 75% (IQ3) | 66.0% | 48.4% |
| Interquartile Range (IQR) | 13.2% | 19.2% |
| Standard Deviation (Sample) | 11.0% | 13.8% |
| Standard Deviation (Population) | 11.0% | 13.7% |
Similar Demographics by College, 1 year or more
Demographics Similar to Immigrants from Jordan by College, 1 year or more
In terms of college, 1 year or more, the demographic groups most similar to Immigrants from Jordan are Immigrants from Chile (61.4%, a difference of 0.080%), Pakistani (61.5%, a difference of 0.10%), Serbian (61.4%, a difference of 0.10%), Assyrian/Chaldean/Syriac (61.5%, a difference of 0.11%), and Venezuelan (61.3%, a difference of 0.12%).
| Demographics | Rating | Rank | College, 1 year or more |
| Danes | 94.8 /100 | #114 | Exceptional 61.7% |
| Norwegians | 94.5 /100 | #115 | Exceptional 61.7% |
| Lebanese | 94.1 /100 | #116 | Exceptional 61.6% |
| Arabs | 93.9 /100 | #117 | Exceptional 61.6% |
| Immigrants | Brazil | 93.9 /100 | #118 | Exceptional 61.6% |
| Assyrians/Chaldeans/Syriacs | 93.3 /100 | #119 | Exceptional 61.5% |
| Pakistanis | 93.2 /100 | #120 | Exceptional 61.5% |
| Immigrants | Jordan | 92.7 /100 | #121 | Exceptional 61.4% |
| Immigrants | Chile | 92.3 /100 | #122 | Exceptional 61.4% |
| Serbians | 92.2 /100 | #123 | Exceptional 61.4% |
| Venezuelans | 92.1 /100 | #124 | Exceptional 61.3% |
| Immigrants | Syria | 91.6 /100 | #125 | Exceptional 61.3% |
| Alsatians | 91.3 /100 | #126 | Exceptional 61.3% |
| Immigrants | Eastern Africa | 91.1 /100 | #127 | Exceptional 61.2% |
| Immigrants | Italy | 91.1 /100 | #128 | Exceptional 61.2% |
Demographics Similar to Immigrants from Guatemala by College, 1 year or more
In terms of college, 1 year or more, the demographic groups most similar to Immigrants from Guatemala are Immigrants from Cuba (50.7%, a difference of 0.010%), Immigrants from Latin America (50.7%, a difference of 0.040%), Dominican (50.6%, a difference of 0.22%), Navajo (50.8%, a difference of 0.23%), and Menominee (50.6%, a difference of 0.26%).
| Demographics | Rating | Rank | College, 1 year or more |
| Cajuns | 0.0 /100 | #316 | Tragic 51.2% |
| Hispanics or Latinos | 0.0 /100 | #317 | Tragic 51.1% |
| Immigrants | Honduras | 0.0 /100 | #318 | Tragic 51.0% |
| Immigrants | El Salvador | 0.0 /100 | #319 | Tragic 51.0% |
| Kiowa | 0.0 /100 | #320 | Tragic 51.0% |
| Hopi | 0.0 /100 | #321 | Tragic 50.9% |
| Navajo | 0.0 /100 | #322 | Tragic 50.8% |
| Immigrants | Guatemala | 0.0 /100 | #323 | Tragic 50.7% |
| Immigrants | Cuba | 0.0 /100 | #324 | Tragic 50.7% |
| Immigrants | Latin America | 0.0 /100 | #325 | Tragic 50.7% |
| Dominicans | 0.0 /100 | #326 | Tragic 50.6% |
| Menominee | 0.0 /100 | #327 | Tragic 50.6% |
| Dutch West Indians | 0.0 /100 | #328 | Tragic 50.5% |
| Cape Verdeans | 0.0 /100 | #329 | Tragic 50.3% |
| Natives/Alaskans | 0.0 /100 | #330 | Tragic 50.2% |