Cheyenne vs Aleut In Labor Force | Age 45-54
COMPARE
Cheyenne
Aleut
In Labor Force | Age 45-54
In Labor Force | Age 45-54 Comparison
Cheyenne
Aleuts
77.6%
IN LABOR FORCE | AGE 45-54
0.0/ 100
METRIC RATING
330th/ 347
METRIC RANK
81.0%
IN LABOR FORCE | AGE 45-54
0.0/ 100
METRIC RATING
282nd/ 347
METRIC RANK
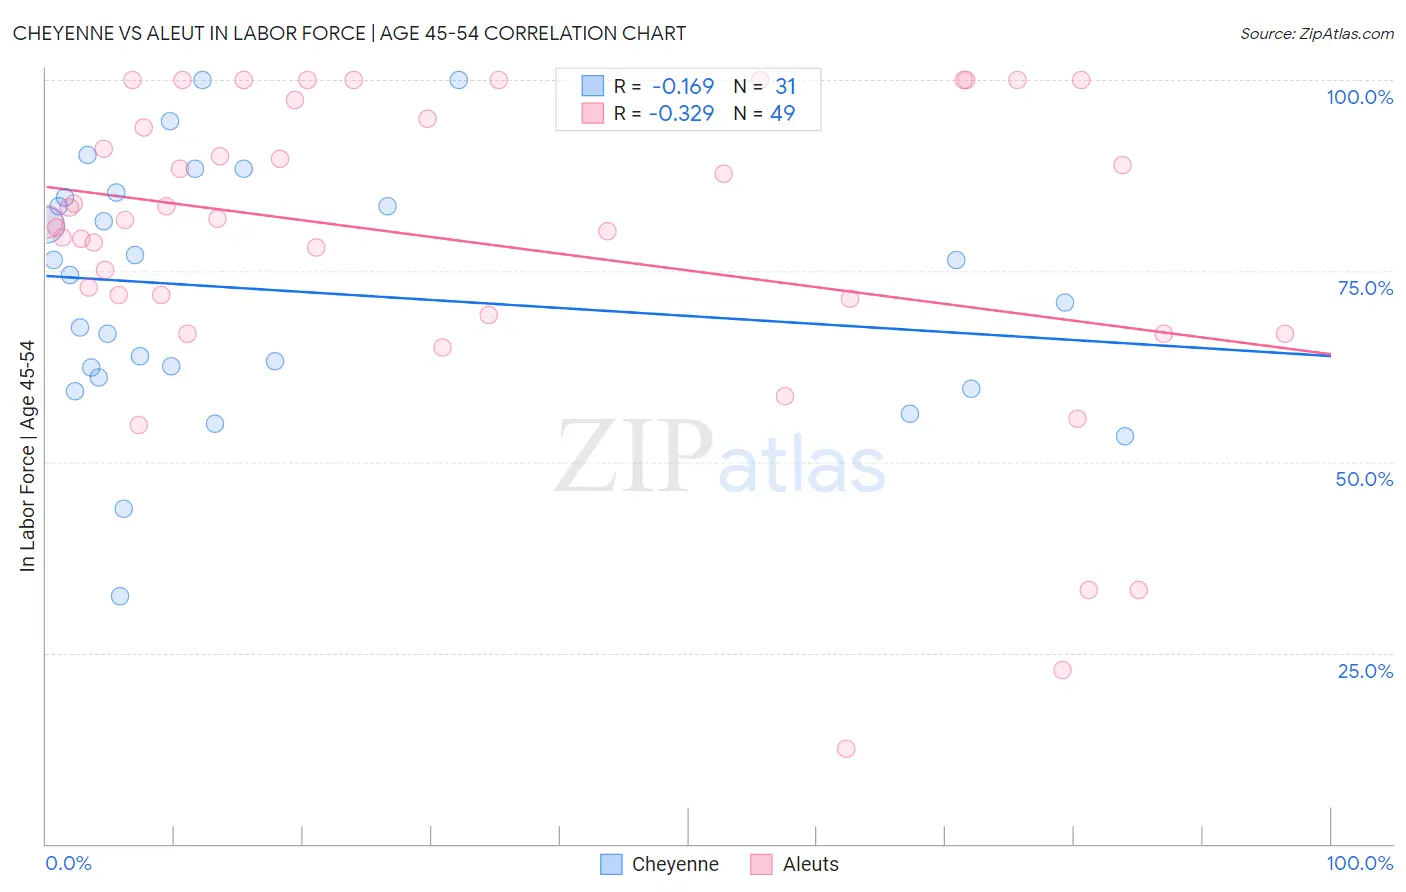
Cheyenne vs Aleut In Labor Force | Age 45-54 Correlation Chart
The statistical analysis conducted on geographies consisting of 80,704,185 people shows a poor negative correlation between the proportion of Cheyenne and labor force participation rate among population between the ages 45 and 54 in the United States with a correlation coefficient (R) of -0.169 and weighted average of 77.6%. Similarly, the statistical analysis conducted on geographies consisting of 61,774,977 people shows a mild negative correlation between the proportion of Aleuts and labor force participation rate among population between the ages 45 and 54 in the United States with a correlation coefficient (R) of -0.329 and weighted average of 81.0%, a difference of 4.4%.
In Labor Force | Age 45-54 Correlation Summary
| Measurement | Cheyenne | Aleut |
| Minimum | 32.4% | 12.5% |
| Maximum | 100.0% | 100.0% |
| Range | 67.6% | 87.5% |
| Mean | 72.4% | 78.8% |
| Median | 74.5% | 81.6% |
| Interquartile 25% (IQ1) | 61.0% | 70.3% |
| Interquartile 75% (IQ3) | 84.5% | 96.2% |
| Interquartile Range (IQR) | 23.5% | 25.9% |
| Standard Deviation (Sample) | 16.2% | 20.7% |
| Standard Deviation (Population) | 15.9% | 20.5% |
Similar Demographics by In Labor Force | Age 45-54
Demographics Similar to Cheyenne by In Labor Force | Age 45-54
In terms of in labor force | age 45-54, the demographic groups most similar to Cheyenne are Tsimshian (77.4%, a difference of 0.15%), Menominee (77.4%, a difference of 0.18%), Creek (77.7%, a difference of 0.22%), Sioux (78.0%, a difference of 0.52%), and Native/Alaskan (77.1%, a difference of 0.54%).
| Demographics | Rating | Rank | In Labor Force | Age 45-54 |
| Kiowa | 0.0 /100 | #323 | Tragic 78.3% |
| Dutch West Indians | 0.0 /100 | #324 | Tragic 78.2% |
| Choctaw | 0.0 /100 | #325 | Tragic 78.2% |
| Seminole | 0.0 /100 | #326 | Tragic 78.1% |
| Cajuns | 0.0 /100 | #327 | Tragic 78.1% |
| Sioux | 0.0 /100 | #328 | Tragic 78.0% |
| Creek | 0.0 /100 | #329 | Tragic 77.7% |
| Cheyenne | 0.0 /100 | #330 | Tragic 77.6% |
| Tsimshian | 0.0 /100 | #331 | Tragic 77.4% |
| Menominee | 0.0 /100 | #332 | Tragic 77.4% |
| Natives/Alaskans | 0.0 /100 | #333 | Tragic 77.1% |
| Apache | 0.0 /100 | #334 | Tragic 77.1% |
| Arapaho | 0.0 /100 | #335 | Tragic 77.1% |
| Paiute | 0.0 /100 | #336 | Tragic 76.7% |
| Ute | 0.0 /100 | #337 | Tragic 76.6% |
Demographics Similar to Aleuts by In Labor Force | Age 45-54
In terms of in labor force | age 45-54, the demographic groups most similar to Aleuts are Immigrants from Latin America (81.0%, a difference of 0.070%), Immigrants from Grenada (81.0%, a difference of 0.070%), French American Indian (80.8%, a difference of 0.17%), Immigrants from Micronesia (81.1%, a difference of 0.18%), and Immigrants from Guatemala (81.1%, a difference of 0.19%).
| Demographics | Rating | Rank | In Labor Force | Age 45-54 |
| Immigrants | Nonimmigrants | 0.0 /100 | #275 | Tragic 81.2% |
| U.S. Virgin Islanders | 0.0 /100 | #276 | Tragic 81.2% |
| Guatemalans | 0.0 /100 | #277 | Tragic 81.2% |
| Immigrants | Guatemala | 0.0 /100 | #278 | Tragic 81.1% |
| Immigrants | Micronesia | 0.0 /100 | #279 | Tragic 81.1% |
| Immigrants | Latin America | 0.0 /100 | #280 | Tragic 81.0% |
| Immigrants | Grenada | 0.0 /100 | #281 | Tragic 81.0% |
| Aleuts | 0.0 /100 | #282 | Tragic 81.0% |
| French American Indians | 0.0 /100 | #283 | Tragic 80.8% |
| Belizeans | 0.0 /100 | #284 | Tragic 80.8% |
| Delaware | 0.0 /100 | #285 | Tragic 80.8% |
| Immigrants | Dominica | 0.0 /100 | #286 | Tragic 80.8% |
| Vietnamese | 0.0 /100 | #287 | Tragic 80.8% |
| Cree | 0.0 /100 | #288 | Tragic 80.8% |
| Immigrants | Bangladesh | 0.0 /100 | #289 | Tragic 80.7% |