Cheyenne vs Mongolian No Schooling Completed
COMPARE
Cheyenne
Mongolian
No Schooling Completed
No Schooling Completed Comparison
Cheyenne
Mongolians
2.1%
NO SCHOOLING COMPLETED
58.6/ 100
METRIC RATING
168th/ 347
METRIC RANK
2.1%
NO SCHOOLING COMPLETED
40.8/ 100
METRIC RATING
185th/ 347
METRIC RANK
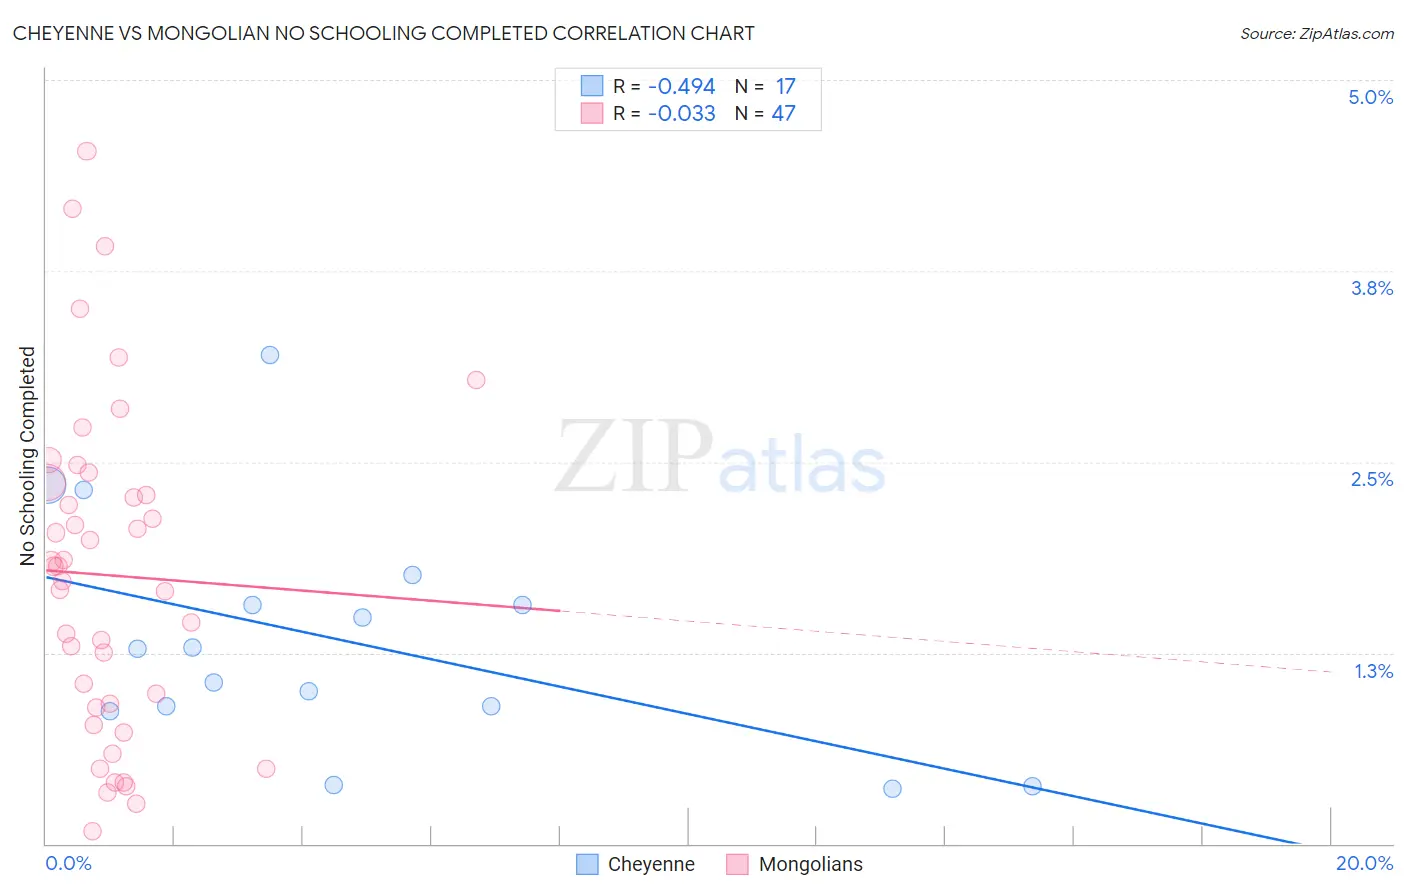
Cheyenne vs Mongolian No Schooling Completed Correlation Chart
The statistical analysis conducted on geographies consisting of 80,362,041 people shows a moderate negative correlation between the proportion of Cheyenne and percentage of population with no schooling in the United States with a correlation coefficient (R) of -0.494 and weighted average of 2.1%. Similarly, the statistical analysis conducted on geographies consisting of 139,824,247 people shows no correlation between the proportion of Mongolians and percentage of population with no schooling in the United States with a correlation coefficient (R) of -0.033 and weighted average of 2.1%, a difference of 2.5%.
No Schooling Completed Correlation Summary
| Measurement | Cheyenne | Mongolian |
| Minimum | 0.36% | 0.080% |
| Maximum | 3.2% | 4.5% |
| Range | 2.8% | 4.5% |
| Mean | 1.3% | 1.8% |
| Median | 1.3% | 1.8% |
| Interquartile 25% (IQ1) | 0.88% | 0.89% |
| Interquartile 75% (IQ3) | 1.7% | 2.4% |
| Interquartile Range (IQR) | 0.78% | 1.5% |
| Standard Deviation (Sample) | 0.76% | 1.1% |
| Standard Deviation (Population) | 0.74% | 1.1% |
Demographics Similar to Cheyenne and Mongolians by No Schooling Completed
In terms of no schooling completed, the demographic groups most similar to Cheyenne are Egyptian (2.1%, a difference of 0.080%), Dutch West Indian (2.1%, a difference of 0.18%), Apache (2.1%, a difference of 0.27%), Argentinean (2.1%, a difference of 0.36%), and Immigrants from Poland (2.1%, a difference of 0.47%). Similarly, the demographic groups most similar to Mongolians are Pima (2.1%, a difference of 0.070%), Black/African American (2.1%, a difference of 0.090%), French American Indian (2.1%, a difference of 0.19%), Immigrants from Taiwan (2.1%, a difference of 0.25%), and Immigrants from Bosnia and Herzegovina (2.1%, a difference of 0.30%).
| Demographics | Rating | Rank | No Schooling Completed |
| Dutch West Indians | 59.9 /100 | #166 | Average 2.1% |
| Egyptians | 59.2 /100 | #167 | Average 2.1% |
| Cheyenne | 58.6 /100 | #168 | Average 2.1% |
| Apache | 56.7 /100 | #169 | Average 2.1% |
| Argentineans | 56.0 /100 | #170 | Average 2.1% |
| Immigrants | Poland | 55.2 /100 | #171 | Average 2.1% |
| Immigrants | Argentina | 52.7 /100 | #172 | Average 2.1% |
| Immigrants | Belarus | 51.8 /100 | #173 | Average 2.1% |
| Immigrants | Micronesia | 50.0 /100 | #174 | Average 2.1% |
| Arabs | 46.4 /100 | #175 | Average 2.1% |
| Panamanians | 45.2 /100 | #176 | Average 2.1% |
| Arapaho | 45.0 /100 | #177 | Average 2.1% |
| Pakistanis | 44.7 /100 | #178 | Average 2.1% |
| Immigrants | Kazakhstan | 44.3 /100 | #179 | Average 2.1% |
| Portuguese | 43.9 /100 | #180 | Average 2.1% |
| Immigrants | Taiwan | 42.6 /100 | #181 | Average 2.1% |
| French American Indians | 42.2 /100 | #182 | Average 2.1% |
| Blacks/African Americans | 41.4 /100 | #183 | Average 2.1% |
| Pima | 41.3 /100 | #184 | Average 2.1% |
| Mongolians | 40.8 /100 | #185 | Average 2.1% |
| Immigrants | Bosnia and Herzegovina | 38.6 /100 | #186 | Fair 2.1% |