Cheyenne vs Houma No Schooling Completed
COMPARE
Cheyenne
Houma
No Schooling Completed
No Schooling Completed Comparison
Cheyenne
Houma
2.1%
NO SCHOOLING COMPLETED
58.6/ 100
METRIC RATING
168th/ 347
METRIC RANK
2.8%
NO SCHOOLING COMPLETED
0.0/ 100
METRIC RATING
295th/ 347
METRIC RANK
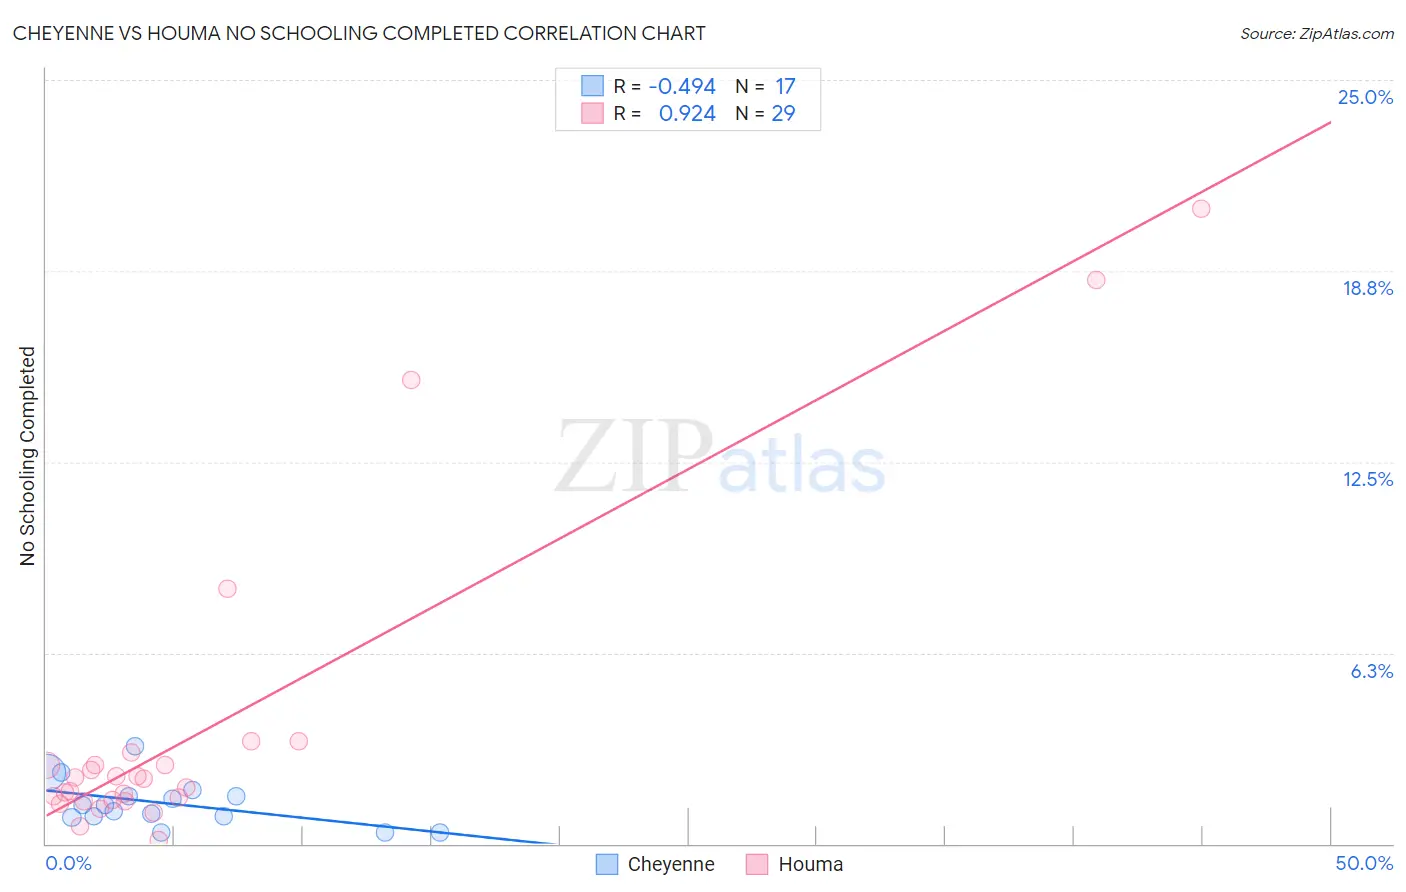
Cheyenne vs Houma No Schooling Completed Correlation Chart
The statistical analysis conducted on geographies consisting of 80,362,041 people shows a moderate negative correlation between the proportion of Cheyenne and percentage of population with no schooling in the United States with a correlation coefficient (R) of -0.494 and weighted average of 2.1%. Similarly, the statistical analysis conducted on geographies consisting of 36,712,306 people shows a near-perfect positive correlation between the proportion of Houma and percentage of population with no schooling in the United States with a correlation coefficient (R) of 0.924 and weighted average of 2.8%, a difference of 34.8%.
No Schooling Completed Correlation Summary
| Measurement | Cheyenne | Houma |
| Minimum | 0.36% | 0.12% |
| Maximum | 3.2% | 20.8% |
| Range | 2.8% | 20.7% |
| Mean | 1.3% | 3.8% |
| Median | 1.3% | 2.1% |
| Interquartile 25% (IQ1) | 0.88% | 1.4% |
| Interquartile 75% (IQ3) | 1.7% | 2.8% |
| Interquartile Range (IQR) | 0.78% | 1.4% |
| Standard Deviation (Sample) | 0.76% | 5.2% |
| Standard Deviation (Population) | 0.74% | 5.1% |
Similar Demographics by No Schooling Completed
Demographics Similar to Cheyenne by No Schooling Completed
In terms of no schooling completed, the demographic groups most similar to Cheyenne are Egyptian (2.1%, a difference of 0.080%), Dutch West Indian (2.1%, a difference of 0.18%), Brazilian (2.1%, a difference of 0.23%), Apache (2.1%, a difference of 0.27%), and Comanche (2.1%, a difference of 0.29%).
| Demographics | Rating | Rank | No Schooling Completed |
| Ugandans | 64.6 /100 | #161 | Good 2.0% |
| Immigrants | Brazil | 63.8 /100 | #162 | Good 2.1% |
| Albanians | 62.2 /100 | #163 | Good 2.1% |
| Comanche | 60.7 /100 | #164 | Good 2.1% |
| Brazilians | 60.2 /100 | #165 | Good 2.1% |
| Dutch West Indians | 59.9 /100 | #166 | Average 2.1% |
| Egyptians | 59.2 /100 | #167 | Average 2.1% |
| Cheyenne | 58.6 /100 | #168 | Average 2.1% |
| Apache | 56.7 /100 | #169 | Average 2.1% |
| Argentineans | 56.0 /100 | #170 | Average 2.1% |
| Immigrants | Poland | 55.2 /100 | #171 | Average 2.1% |
| Immigrants | Argentina | 52.7 /100 | #172 | Average 2.1% |
| Immigrants | Belarus | 51.8 /100 | #173 | Average 2.1% |
| Immigrants | Micronesia | 50.0 /100 | #174 | Average 2.1% |
| Arabs | 46.4 /100 | #175 | Average 2.1% |
Demographics Similar to Houma by No Schooling Completed
In terms of no schooling completed, the demographic groups most similar to Houma are Immigrants (2.8%, a difference of 0.10%), Immigrants from Eritrea (2.8%, a difference of 0.52%), Malaysian (2.8%, a difference of 0.69%), Immigrants from Grenada (2.8%, a difference of 1.1%), and Immigrants from Cuba (2.8%, a difference of 1.3%).
| Demographics | Rating | Rank | No Schooling Completed |
| Immigrants | St. Vincent and the Grenadines | 0.0 /100 | #288 | Tragic 2.7% |
| Immigrants | Thailand | 0.0 /100 | #289 | Tragic 2.7% |
| Immigrants | Hong Kong | 0.0 /100 | #290 | Tragic 2.7% |
| British West Indians | 0.0 /100 | #291 | Tragic 2.7% |
| Immigrants | Grenada | 0.0 /100 | #292 | Tragic 2.8% |
| Malaysians | 0.0 /100 | #293 | Tragic 2.8% |
| Immigrants | Eritrea | 0.0 /100 | #294 | Tragic 2.8% |
| Houma | 0.0 /100 | #295 | Tragic 2.8% |
| Immigrants | Immigrants | 0.0 /100 | #296 | Tragic 2.8% |
| Immigrants | Cuba | 0.0 /100 | #297 | Tragic 2.8% |
| Immigrants | Dominica | 0.0 /100 | #298 | Tragic 2.8% |
| Central American Indians | 0.0 /100 | #299 | Tragic 2.8% |
| Haitians | 0.0 /100 | #300 | Tragic 2.9% |
| Immigrants | South Eastern Asia | 0.0 /100 | #301 | Tragic 2.9% |
| Immigrants | Caribbean | 0.0 /100 | #302 | Tragic 2.9% |